机器学习笔记 tensorflow实现在cifar10数据集上的cnn
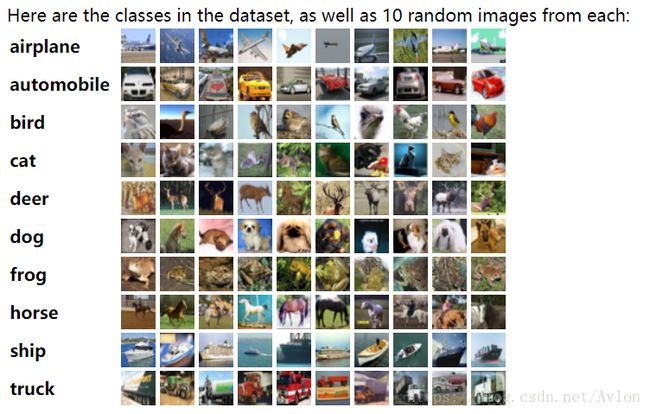
主要是试着使用一下cifar-10数据集,cifar-10数据集为60000张32*32*3的彩色图片,总共有10个类别,其中50000张训练集,10000张测试集。
下载地址:http://www.cs.toronto.edu/~kriz/cifar.html
代码与google的例子和网上的版本大致相同,主要的区别是使用了cifar10的python版数据,自己写了一个读取和随机抽取数据的程序,网上的版本大多使用google的例子中的cifar10_input.py下的输入函数,会进行数据增强,自己手写的没有数据增强,google例子中使用Session读取数据我跑的时候会卡住,网上说Session效率极低。
下面先给出这部分的代码,我将读取数据相关的程序写在了input.py中
import pickle
import numpy as np
import random


def load(file_name):
    with open(file_name, 'rb') as fo:
        data = pickle.load(fo, encoding='bytes')
        return data


def get_train():
    data1 = load('D:\IDE\Project\Pycharm_Project\Cifar10_Project\cifar-10-batches-py\data_batch_1')
    x1 = np.array(data1[b'data'])
    x1 = x1.reshape(-1, 32, 32, 3)
    y1 = np.array(data1[b'labels'])
    data2 = load('D:\IDE\Project\Pycharm_Project\Cifar10_Project\cifar-10-batches-py\data_batch_2')
    x2 = np.array(data2[b'data'])
    x2 = x2.reshape(-1, 32, 32, 3)
    y2 = np.array(data2[b'labels'])
    train_data = np.r_[x1, x2]
    train_labels = np.r_[y1, y2]
    data3 = load('D:\IDE\Project\Pycharm_Project\Cifar10_Project\cifar-10-batches-py\data_batch_3')
    x3 = np.array(data3[b'data'])
    x3 = x3.reshape(-1, 32, 32, 3)
    y3 = data3[b'labels']
    train_data = np.r_[train_data, x3]
    train_labels = np.r_[train_labels, y3]
    data4 = load('D:\IDE\Project\Pycharm_Project\Cifar10_Project\cifar-10-batches-py\data_batch_4')
    x4 = np.array(data4[b'data'])
    x4 = x4.reshape(-1, 32, 32, 3)
    y4 = data4[b'labels']
    train_data = np.r_[train_data, x4]
    train_labels = np.r_[train_labels, y4]
    return list(train_data), list(train_labels)


def get_test():
    data1 = load('D:\IDE\Project\Pycharm_Project\Cifar10_Project\cifar-10-batches-py\\test_batch')
    x = np.array(data1[b'data'])
    x = x.reshape(-1, 32, 32, 3)
    y = data1[b'labels']
    return list(x), list(y)


def get_batch(batch_size, image, label):
    batch_image = list()
    batch_label = list()
    indexs = list()
    for i in range(batch_size):
        index = random.randint(0, len(image)-1)
        while index in indexs:
            index = random.randint(0, len(image)-1)
        d = list(image[index])
        batch_image.append(d)
        z = label[index]
        batch_label.append(z)
        indexs.append(index)
    return batch_image, batch_label
cifar10的python版解压出来后算上test共有6个batch,前五个是train用的每个包含10000个图片信息和标签信息,用pickle读取后是一个字典,用keys()可以打印出关键字,利用关键字读取,get_batch()是一个随机抽取(不放回)一定数量样本的函数,原本使用list.sample()是可以抽取的可是label和image是分开的必须保持一致。
解决了数据读取问题后就和google的例子基本一致了,首先封装了一些tf中的重复操作在init.py中下面给出代码,函数名可读性还是很强的,就不做过多介绍。
import tensorflow as tf


def l2_weight_init(shape, stddev, w1):
    weight = tf.Variable(tf.truncated_normal(shape, stddev=stddev))
    if w1 is not None:
        weight_loss = tf.multiply(tf.nn.l2_loss(weight), w1, name="weight_loss")
        tf.add_to_collection("losses", weight_loss)
    return weight


def weight_init(shape, stddev):
    weight = tf.Variable(tf.truncated_normal(shape, stddev=stddev))
    return weight


def bias_init(shape):
    return tf.Variable(tf.random_normal(shape))


def conv2d(image, weight):
    return tf.nn.conv2d(image, weight, strides=[1, 1, 1, 1], padding="SAME")


def max_pool(tensor):
    return tf.nn.max_pool(tensor, ksize=[1, 3, 3, 1], strides=[1, 2, 2, 1], padding="SAME")
下面是主要代码,两层卷积层两层全连接层,用了LR正则化防止过拟合
import tensorflow as tf
import input
import numpy as np
import Init
import matplotlib.pyplot as plt
import random


max_steps = 5000
batch_size = 128
display = 100


def LRnorm(tensor):
    return tf.nn.lrn(tensor, 4, bias=1.0, alpha=0.001/9.0, beta=0.75)


def accuracy(test_labels, test_y_out):
    test_labels = tf.to_int64(test_labels)
    prediction_result = tf.equal(test_labels, tf.argmax(y_, 1))
    accu = tf.reduce_mean(tf.cast(prediction_result, tf.float32))
    return accu

# train_image, train_label = cifar10_input.distorted_inputs(batch_size=batch_size, data_dir="cifar-10-batches-bin")
# test_image, test_label = cifar10_input.inputs(batch_size=batch_size, data_dir="cifar-10-batches-bin", eval_data=True)

with tf.name_scope('Input'):
    image = tf.placeholder('float', [batch_size, 32, 32, 3])
    label = tf.placeholder('float', [batch_size])

with tf.name_scope('ConLayer_1'):
    we1 = Init.weight_init([5, 5, 3, 32], 0.05)
    b1 = Init.bias_init([32])
    conv1 = tf.nn.relu(Init.conv2d(image, we1)+b1)
    pool1 = Init.max_pool(conv1)
    LRn1 = LRnorm(pool1)

with tf.name_scope('ConLayer_2'):
    w2 = Init.weight_init([5, 5, 32, 32], 0.05)
    b2 = Init.bias_init([32])
    conv2 = tf.nn.relu(Init.conv2d(LRn1, w2)+b2)
    LRn2 = LRnorm(conv2)
    pool2 = Init.max_pool(LRn2)

with tf.name_scope('FullLayer_1'):
    reshape = tf.reshape(pool2, [batch_size, -1])
    n_input = reshape.get_shape()[1].value
    w3 = Init.l2_weight_init([n_input, 128], 0.05, w1=0.001)
    b3 = Init.bias_init([128])
    full_1 = tf.nn.relu(tf.matmul(reshape, w3)+b3)

with tf.name_scope("FullLayer_2"):
    w4 = Init.l2_weight_init([128, 64], 0.05, w1=0.003)
    b4 = Init.bias_init([64])
    full_2 = tf.nn.relu(tf.matmul(full_1, w4)+b4)

with tf.name_scope('Inference'):
    w5 = Init.weight_init([64, 10], 1/96.0)
    b5 = Init.bias_init([10])
    logits = tf.add(tf.matmul(full_2, w5), b5)
    y_ = tf.nn.softmax(logits)

with tf.name_scope('Loss'):
    label = tf.cast(label, tf.int64)
    cross_entropy = tf.nn.sparse_softmax_cross_entropy_with_logits(logits=logits, labels=label)
    cross_entropy_mean = tf.reduce_mean(cross_entropy)
    tf.add_to_collection('losses', cross_entropy_mean)
    loss = tf.add_n(tf.get_collection('losses'), name='total_loss')

train_op = tf.train.AdamOptimizer(0.0001).minimize(loss)

top_k_op = tf.nn.in_top_k(logits, label, 1)

init = tf.global_variables_initializer()
sess = tf.Session()
sess.run(init)

# tf.train.start_queue_runners(sess=sess)

Cross_loss = []
print("start")
train_image, train_label = input.get_train()

for i in range(5000):
    # batch_images, batch_labels = sess.run([train_image, train_label])           #用session读取数据效率低,改成python读取
    batch_images, batch_labels = input.get_batch(batch_size, train_image, train_label)
    _, cross_entropy = sess.run([train_op, loss], feed_dict={image: batch_images, label: batch_labels})
    Cross_loss.append(cross_entropy)
    if i % display == 0:
        print('epoch', i, 'loss:', cross_entropy)


test_image, test_label = input.get_test()
for i in range(10):
    test_batch_image, test_batch_label = input.get_batch(batch_size, test_image, test_label)
    ys = sess.run([top_k_op], feed_dict={image: test_batch_image, label: test_batch_label})
    print(np.sum(ys)/batch_size)

fig, ax = plt.subplots(figsize=(13, 6))
ax.plot(Cross_loss)
plt.grid()
plt.title('Train loss')
plt.show()
写这个的主要目的是接触一下mnist以外的数据集,毕竟mnist数据还是太弱了,上述程序能大概实现60%的预测精度
loss值的图如下,超参数肯定不是最优,不过目的并不是调参,有兴趣可以找找更好的超参数
随机抽取10个test数据集中的数据统计准确率


