matplotlib 详解3 面向对象
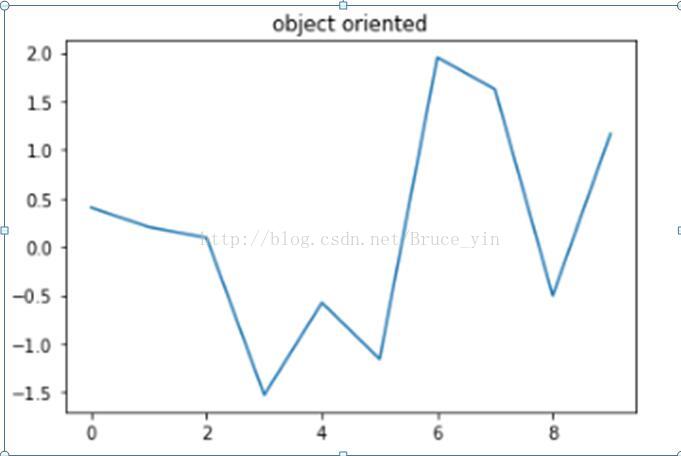
1. 面向对象
importmatplotlib.pyplot as plt
importnumpy as np
x=np.arange(0,10,1)
y=np.random.randn(len(x))
fig=plt.figure()
ax=fig.add_subplot(111)
l,=plt.plot(x,y)
t =ax.set_title('object oriented')
plt.show()
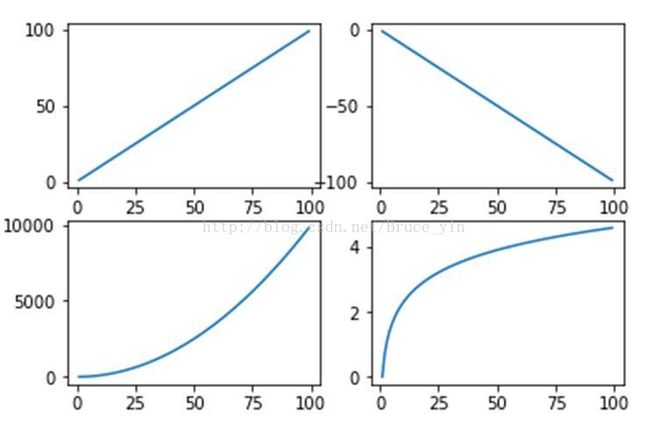
Lesson 11 在同一个画布上做多张图
importnumpy as np
x = np.arange(1,100)
fig = plt.figure()
ax1=fig.add_subplot(221)
ax1.plot(x,x)
ax2=fig.add_subplot(222)
ax2.plot(x,-x)
ax3=fig.add_subplot(223)
ax3.plot(x,x*x)
ax4=fig.add_subplot(224)
ax4.plot(x,np.log(x))
plt.show()

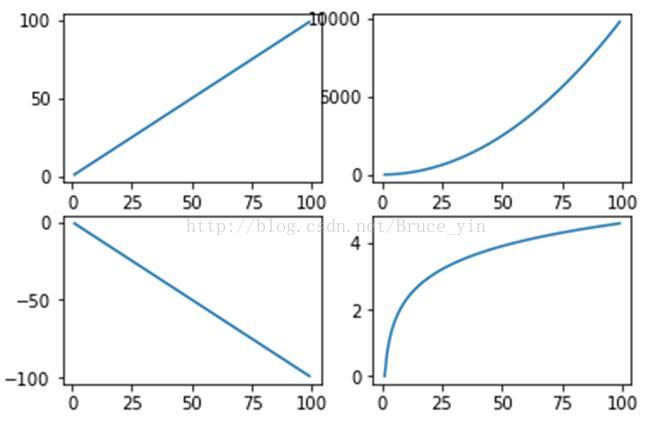
x=np.arange(1,100)
plt.subplot(221)
plt.plot(x,x)
plt.subplot(222)
plt.plot(x,x*x)
plt.subplot(223)
plt.plot(x,-x)
plt.subplot(224)
plt.plot(x,np.log(x))
plt.show()

lesson 12同时产生两张图
import matplotlib.pyplot as plt
fig1 = plt.figure()
ax1= fig1.add_subplot(111)
ax1.plot([1,2,3],[3,2,1])
fig2 = plt.figure()
ax2= fig2.add_subplot(111)
ax2.plot([1,2,3],[1,2,3])
plt.show()
lesson 13 网格
plt.grid(color=’r’, linestyle =’--’, linewidth= ‘2’)
lesson 14 图例
plt.plot(x,y, label =’xxxx’)
plt.legend(loc=0) #位置
plt.legend(ncol=3) #几列
plt.legend([‘normal’,’fast’,’faster’])
lesson 15 坐标轴的调整
原来plt.axis()
(-10.0,10.0,0.0,100)
修改
plt.axis([-5,5,20,60])
修改:plt.xlim([0,60])
plt.xlim(xmin=-5)
lesson 16 修改坐标轴
x = np.arange(1,11,1)
plt.plot(x,x)
ax = plt.gca()
ax.locator_params(‘y’,nbins=5)
plt.show()
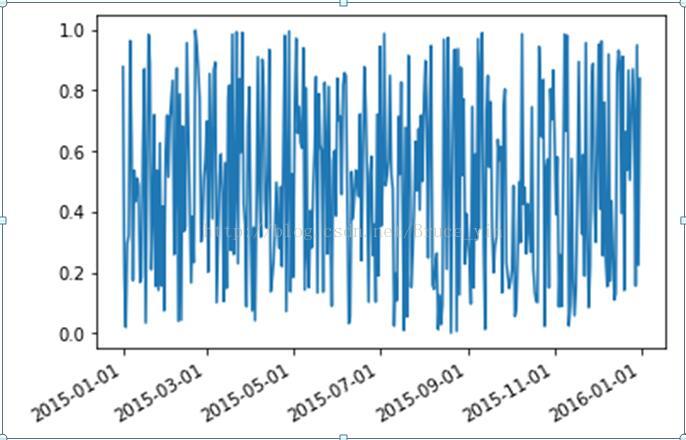
lesson 16 修改日期的坐标轴
importmatplotlib.pyplot as plt
importnumpy as np
importdatetime
importmatplotlib as mpl
fig = plt.figure()
start = datetime.datetime(2015,1,1)
stop = datetime.datetime(2016,1,1)
delta = datetime.timedelta(days=1)
dates = mpl.dates.drange(start, stop,delta)
y= np.random.rand(len(dates))
ax = plt.gca()
ax.plot_date(dates,y,linestyle='-',marker='')
date_format = mpl.dates.DateFormatter("%Y-%m-%d")
ax.xaxis.set_major_formatter(date_format)
fig.autofmt_xdate()
plt.show()


