人工神经网络
一、神经网络的模型:
图1 两层全连接神经网络模型
这个是一个带有两个全连接层的神经网络,神经网络,一般不把输入层算在层数之中。
1、神经元:
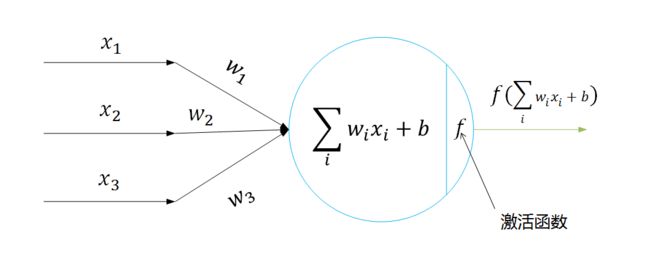
图2 神经元的数学模型
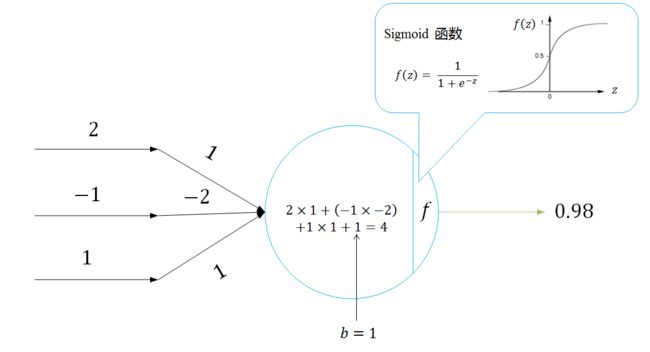
从单个神经元来看,每个神经元可以看做是一个感知机,可以用来做决策,从图中可以看出,根据输入的线性组合,经过函数f来预测,比如Sigmoid函数,当输出值大于0.5的时候可以判定为正类,当输出值小于0.5的时候,可以判定为负类。这像什么?逻辑回归!举个神经元的例子:
图3 神经元示例
2、激活函数
激活函数有很多种类,比如,线性函数、Sigmoid函数、tanh函数、ReLU函数等,本文只列举三个类型的激活函数:
图4 Sigmoid函数和tanh函数
Sigmoid函数和tanh函数,有一个共同的问题就是,当数据很大的时候,就是图中两个所指的方向,在反向传播的过程中,会导致梯度消失。神经元的激活值在0或者1附近的时候,梯度几乎为零,那么在反向传播的时候梯度就会被“杀死”。其实很好理解,在两个所指方向上,函数越来越趋于水平,因此在求导的时候,所得梯度为0或者很小---近似于0,这样在反向传播的时候,梯度就为零了(或者近似于0),因此梯度就消失了,权重就无法更新,因此这两个函数在神经网络中不在常用。但是相比较而言tanh比Sigmoid函数要更受欢迎,因为tanh的数据输出是中心化的。
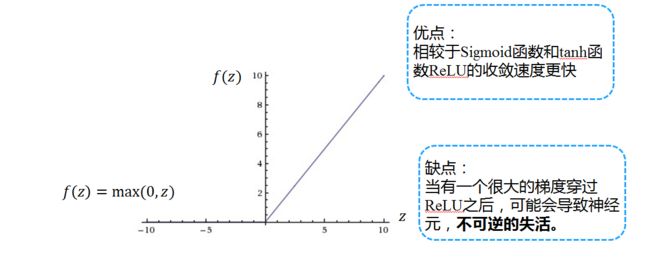
图5 ReLU函数
ReLU的优缺点图中已经的说明,但是对于缺点,我的理解是:当有一个特别大的梯度经过的时候,权重会被更新为一个特别小的负数(比如负无穷),那么当再次经过该神经元的时候,该神经元的输入值为负数,那么ReLU输出值就是0了,但是依旧会有梯度来更新对应权重,但是更新的值不足以让该神经元的输入值为正(就好比一个负无穷加上一个整数N,它依旧是一个很小的数),那么这样就会导致该神经元的不可逆转的失活。
那么到此可以对神经网络有一个理解:可以认为神经网络定义了一个由一系列的函数组成的函数族,网络的权重就是函数中的参数,神经经网络可以近似任何函数。(这个是被证明了的)。
二、前向传播和反向传播:
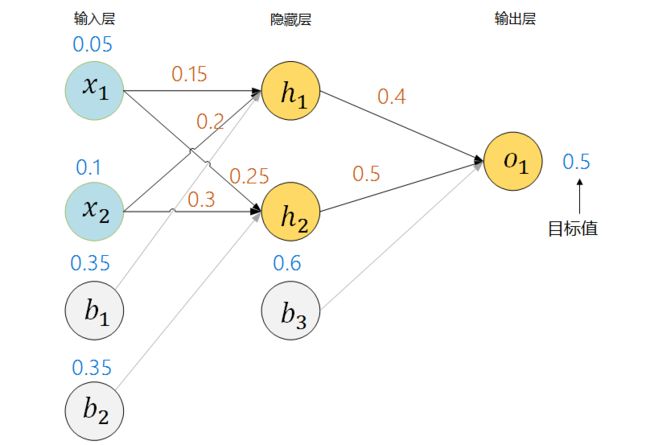
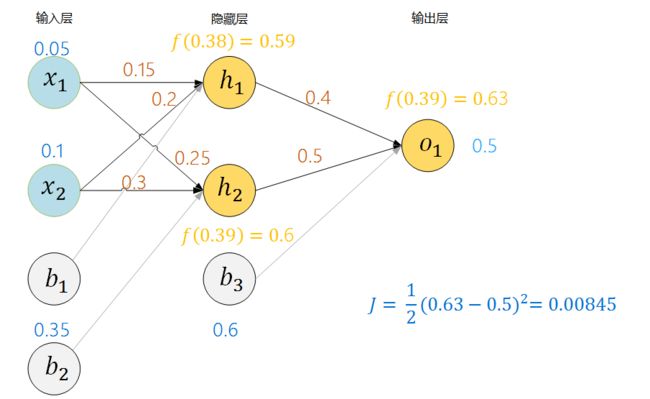
前向传播很简单,如下一个例子:
图6 神经网络示例
蓝色数字代表对应权重和偏值的数值,我们的目标是让这神经网络输出值为0.5或者非常接近0.5.
计算隐藏层神经元h1的输入,0.15 * 0.05 + 0.2 * 0.1 + 0.35 = 0.38,h1的输出:f(0.38) = 0.59,其中f为Sigmoid函数,同理可以计算出神经元h2的输入和输出。于是有下图:
图7 前向传播示例
由于输出值为0.63,不是我们想要的0.5,最起码不太接近0.5,那么我们就要更新权重和偏值,训练神经网络的目的就是训练权重和偏值,他们使得网络输出我们想要的结果。那么如何来更新权重呢?采用反向传播的方法,反向传播其实很简单,说白一点就是一系列的链式求导,本文不准备讲理论推到,具体的理论推到请看:
http://blog.csdn.net/hearthougan/article/details/55812728
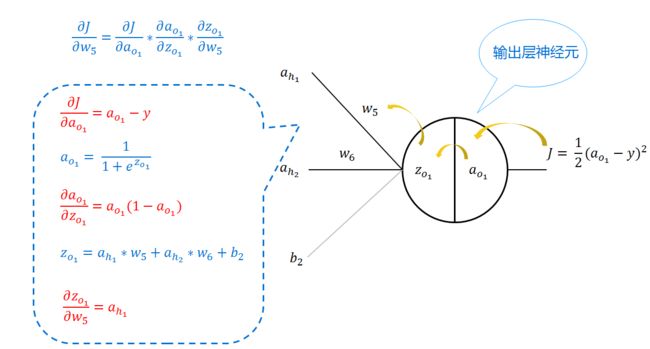
我也不建议只看理论推到,看懂了,不如找一个小例子实际推到一番来的透彻,本文只简单讲一下如何的反向传播,比如我们现在得到了损失,也有了损失函数,我们要更新w5、w6、和b3,要更新他们,就要分别求出它们的梯度,现以求w5的梯度来说明,如下图:
图8 反向传播示例
w5如果懂了,其他的也就是知道了。假设学习率为0.5,那么最后更新权重为:
三、在CIFAR10和MNIST数据集上的实验结果
为了试验神经网络的效果我在,CIFAR10和MNIST上各测试了一下,MNIST的准确率为97.2%,而CIFAR10只有52%,但是相比较SVM和Softmax,神经网络的正确率还是提高了很多,之所以在CIFAR10上的正确率不高,个人认为它的图片背景更加复杂,图片为三通道的,而MNIST的图片背景就比较简单而且是单通道的。
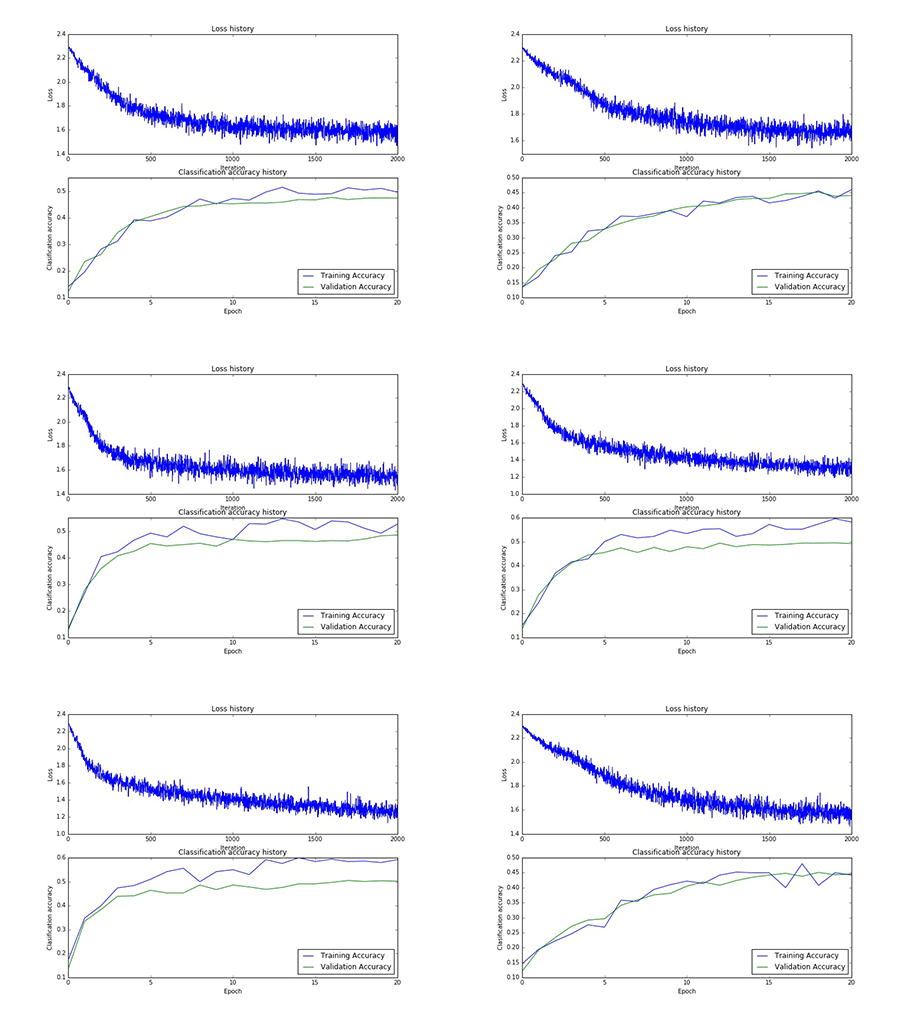
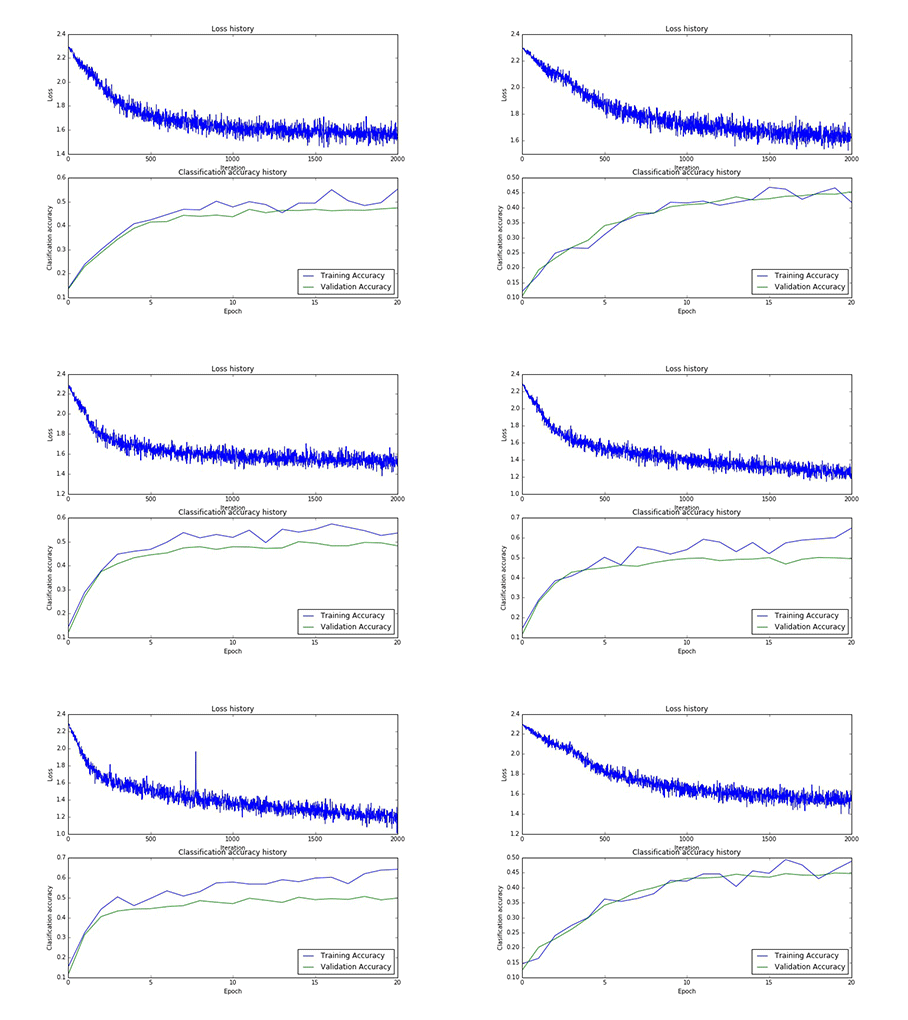
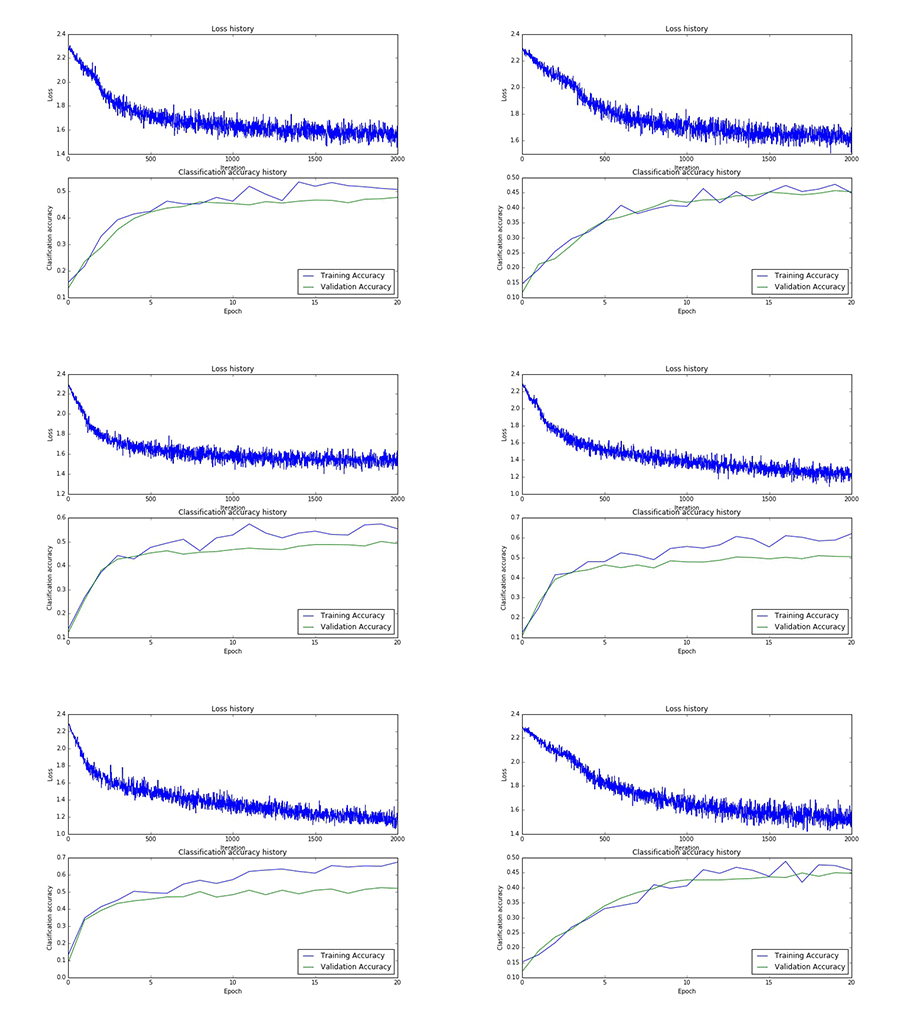
本实验总共采用了75次寻参,其中隐藏层神经元的个数有[50, 75, 100]三类,每一类寻参(学习率和正则项)过程中,第一层权重W1的样子,和对应的损失以及在训练集合验证集上的正确率,现以gif的形式呈现:
1、现展示CIFAR10:
图9 50个神经元对应的W1和50个神经元寻参时对应的损失和正确率
图10 75个神经元对应的W1和75个神经元寻参时对应的损失和正确率
图11 100个神经元对应的W1和100个神经元寻参时对应的损失和正确率
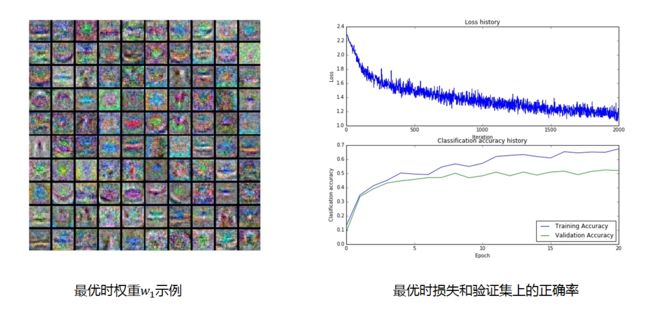
在CIFAR10数据集上整个寻参之后,得到的最优W1和对应的损失以及正确率如下:
图12 最优参数显示
在寻到最优参数之后,在测试集上的正确率为52%
MNIST数据集显示:
(Sorry)MNIST数据集的gif超过2M,无法上传,只贴一张最优参数的静态图图吧:
在测试集上的正确率97.2%
全连接代码:
# -*- coding: utf-8 -*-
"""
Created on Fri May 19 23:23:42 2017

@author: Abner
"""

import numpy as np
import matplotlib.pyplot as plt


class TwoLayerNet(object):
    """
    一个两层的全连接神经网络,输入层的神经元的个数为D,隐藏层的神经元的个数为:H,
    输出层神经元的个数为C,利用Softmax损失函数和L2正则项来训练神经网络,第一个
    全连接层的激活函数为ReLU

    网络的结构为:
    输入层 - 全连接层(第一个隐藏层) - ReLU - 全连接层(输出层) - Softmax

    第二全连接层是输出层,输出的结果就是每个类别的得分。
    """
    def __init__(self, input_size, hidden_size, output_size, std = 1e-4):
        """
        初始化模型:
        权重被初始化很小的随机值,偏值被初始化为0,权重和偏值存放在self.params中,
        params是一个字典结构:

        W1:第一个全连接层的权重,大小为:(D, H)
        b1:第一层的偏值,大小为:(H,)
        W2:第二个全连接层的权重,大下为:(H, C)
        b2:第二层的偏值,大小为:(C,)

        input_size:输入层的维数,D
        hidden_size:隐藏层神经元的个数,H
        output_size:输出层类别数,C

        """
        self.params = {}
        self.params['W1'] = std * np.random.rand(input_size, hidden_size)
        self.params['b1'] = np.zeros(hidden_size)
        self.params['W2'] = std * np.random.rand(hidden_size, output_size)
        self.params['b2'] = np.zeros(output_size)


    def loss(self, X, y = None, reg = 0.0):
        """
        计算两层全连接神经网络的损失和梯度。

        输入:
        X:数据的输入大小为(N, D),每个X[i]是一个样本
        y: 训练样本标签,y[i]是X[i]对应的标签,参数y是可选择的,如果没有对y传参,
        那么该损失函数只返回得分;如果传参,那么loss就返回损失和梯度。
        reg:正则系数

        返回:
        如果y为空,返回一个大小为(N, C)的scores矩阵,其中scores[i, c]是样本X[i]是类别
        c时的得分。

        如果y不为空,那么就返回一个元组:
        -loss:每批训练样本的损失,数据损失和正则损失
        -grads:一个字典,存放的是权重(或者是偏值)和其对应的梯度

        """

        W1, b1 = self.params['W1'], self.params['b1']
        W2, b2 = self.params['W2'], self.params['b2']
        N, D = X.shape

        #计算前向传播
        scores = None

        f = lambda x : np.maximum(0, x)
        h1 = f(np.dot(X, W1) + b1)
        h2 = np.dot(h1, W2) + b2

        scores = h2

        if y is None:
            return scores

        loss = None
        shift_scores = scores - np.max(scores, axis = 1).reshape(-1, 1)
        softmax_output = np.exp(shift_scores)/np.sum(np.exp(shift_scores), axis = 1).reshape(-1, 1)
        loss = -np.sum(np.log(softmax_output[range(N), list(y)]))
        loss /= N
        loss += reg * 0.5 * (np.sum(W1 * W1) + np.sum(W2 * W2))

        #反向传播,计算梯度
        grads = {}
        """
        计算反向传播,对权重和偏值进行求导,然后存放在一个字典中 ,比如,grads['W1']
        应该存放W1的梯度,grads的梯度应该和W1的大小是相同的,grads['b1']与b1的大小
        是相同的。
        """
        #得分对应损失函数的梯度
        descores = softmax_output.copy()#N*C
        descores[range(N), list(y)] -= 1#N*C
        grads['W2'] = 1.0/N * h1.T.dot(descores) + reg * W2#H*C
        grads['b2'] = 1.0/N * np.sum(descores, axis = 0)#C*1

        dh1 = descores.dot(W2.T)#N*H
        dh1_ReLU = (X.dot(W1) + b1 > 0) * dh1#N*H
        grads['W1'] = 1.0/N * X.T.dot(dh1_ReLU) + reg * W1#D*H
        grads['b1'] = 1.0/N * np.sum(dh1_ReLU, axis = 0)#H*!

        return loss, grads

    def train(self, X, y, X_val, y_val, learning_rate = 1e-3,
              learning_rate_decay = 0.95, reg = 1e-5, num_iters = 100,
              batch_size = 200, verbose = False):
        """
        训练神经网络,利用随机梯度
        输入:
        X:(N,D)
        y:(N,)
        X_val:给定的验证数据集,(N_val, D)
        y_val:给定验证集的标签,(N_val,)
        learning_rate:最优化时候的步长
        learning_rate_decay:用于每个epoch学习率减少的标量值
        reg:正则强度
        num_iters:最优化时迭代的次数
        batch_size:每批样本的个数
        verbose:布尔值,如果为真,就打印最优化的过程
        """

        num_train = X.shape[0]
        iterations_per_epoch = max(num_train/batch_size, 1)

        #使用随机梯度(SGD)来最优化self.model中的参数
        loss_history = []
        train_acc_history = []
        val_acc_history = []

        for it in range(num_iters):
            X_batch = None
            y_batch = None

            """
            TODO:
            创建一个训练数据集和对应标签的随机minibatch,并把他们分别储存在X_batch和y_batch
            """

            idx = np.random.choice(num_train, batch_size, replace = True)
            X_batch = X[idx]
            y_batch = y[idx]

            #利用当前的minibatch来计算损失和梯度
            loss, grads = self.loss(X_batch, y = y_batch, reg = reg)
            loss_history.append(loss)

            """
            TODO:
                利用self.params中的梯度来更新网络中的参数
            """
            self.params['W1'] = self.params['W1'] - learning_rate*grads['W1']
            self.params['W2'] = self.params['W2'] - learning_rate*grads['W2']
            self.params['b1'] = self.params['b1'] - learning_rate*grads['b1']
            self.params['b2'] = self.params['b2'] - learning_rate*grads['b2']

            if verbose and it % 100 == 0:
                print 'iteratrion %d / %d: loss %f' % (it, num_iters, loss)

            #每个epoch检查训练、验证集上的准确率,以及缩减学习率
            if it % iterations_per_epoch == 0:
                #检验正确率
                train_acc = (self.predict(X_batch) == y_batch).mean()
                val_acc = (self.predict(X_val) == y_val).mean()
                train_acc_history.append(train_acc)
                val_acc_history.append(val_acc)

                #缩减学习率
                learning_rate *= learning_rate_decay
        return {
            'loss_history':loss_history,
            'train_acc_history':train_acc_history,
            'val_acc_history':val_acc_history,
        }
    def predict(self, X):
        """
        利用已经训练好权重的两层全连接神经网络训来预测数据的标签,对于每一数据我们预测
        C个类别的得分,然后把得分最高的标签定位数据的标签。

        输入:
        - X输入数据,N*D
        返回:
        - y_pred:给定数据集对应的预测标签
        """

        y_pred = None

        f = lambda x: np.maximum(0, x)
        h1 = f(np.dot(X, self.params['W1']) + self.params['b1'])
        h2 = np.dot(h1, self.params['W2']) + self.params['b2']
        scores = h2

        y_pred = np.argmax(scores, axis = 1)

        return y_pred
# -*- coding: utf-8 -*-
"""
Created on Sun May  7 19:32:30 2017

@author: admin
"""
import numpy as np
import pickle
import os

def Load_CIFAR_Batch(filename):
    with open(filename, 'rb') as f:
        datadict = pickle.load(f)
        X = datadict['data']
        Y = datadict['labels']
        X = X.reshape(10000, 3, 32, 32).transpose(0, 2, 3, 1).astype('float')#1000*32*32*3
        Y = np.array(Y)
        return X, Y

def Load_CIFAR10(Root):
    xs = []
    ys = []

    for b in range(1,  6):
        f = os.path.join(Root, 'data_batch_%d'%(b, ))
        X, Y = Load_CIFAR_Batch(f)
        xs.append(X)
        ys.append(Y)
    Xtr = np.concatenate(xs)
    Ytr = np.concatenate(ys)

    del X, Y
    Xte, Yte = Load_CIFAR_Batch(os.path.join(Root, 'test_batch'))
    return Xtr, Ytr, Xte, Yte
# -*- coding: utf-8 -*-
"""
Created on Sun May 21 16:58:49 2017

@author: Abner
"""

'''
    使用python解析二进制文件
'''
import numpy as np
import cPickle as pickle
import struct


def Load_MNIST(Data_dir,label_dir):
    """
    读取数据
    """
    binfile = open(Data_dir, 'rb') # 读取二进制文件
    buffers = binfile.read()

    head = struct.unpack_from('>IIII', buffers, 0) # 取前4个整数,返回一个元组

    offset = struct.calcsize('>IIII')  # 定位到data开始的位置
    imgNum = head[1]
    width = head[2]
    height = head[3]

    bits = imgNum * width * height  # data一共有60000*28*28个像素值
    bitsString = '>' + str(bits) + 'B'  # fmt格式:'>47040000B'

    imgs = struct.unpack_from(bitsString, buffers, offset) # 取data数据,返回一个元组

    binfile.close()
    imgs = np.reshape(imgs, [imgNum, width * height]) # reshape为[60000,784]型数组
    """"
    读取Label
    """
    binfile = open(label_dir, 'rb') # 读二进制文件
    buffers = binfile.read()

    head = struct.unpack_from('>II', buffers, 0) # 取label文件前2个整形数

    labelNum = head[1]
    offset = struct.calcsize('>II')  # 定位到label数据开始的位置

    numString = '>' + str(labelNum) + "B" # fmt格式:'>60000B'
    labels = struct.unpack_from(numString, buffers, offset) # 取label数据

    binfile.close()
    labels = np.reshape(labels, [labelNum]) # 转型为列表(一维数组)

    return imgs, labels

def Load_MNIST_Data():
    train_path_lable_dir = 'MNIST\\train-labels.idx1-ubyte'
    train_path_Data_dir = 'MNIST\\train-images.idx3-ubyte'
    test_path_Data_dir = 'MNIST\\t10k-images.idx3-ubyte'
    test_path_lable_dir = 'MNIST\\t10k-labels.idx1-ubyte'

    Xtr, ytr = Load_MNIST(train_path_Data_dir ,train_path_lable_dir)
    Xte, yte = Load_MNIST(test_path_Data_dir, test_path_lable_dir)

    return Xtr, ytr, Xte, yte

"""
if __name__ == "__main__":
    Xtr, ytr, Xte, yte = Load_MNIST_Data()

    print("Xtr: ", Xtr.shape)
    print("ytr: ", ytr.shape)

    print('----------我是分割线-----------')

    print("Xte: ", Xte.shape)
    print("yte: ", yte.shape)
"""
权重可视化:
# -*- coding: utf-8 -*-
"""
Created on Sun May 21 19:08:24 2017

@author: Abner
"""

from math import sqrt, ceil
import numpy as np

def visualize_grid(Xs, ubound=255.0, padding=1):
  """
  Reshape a 4D tensor of image data to a grid for easy visualization.

  Inputs:
  - Xs: Data of shape (N, H, W, C)
  - ubound: Output grid will have values scaled to the range [0, ubound]
  - padding: The number of blank pixels between elements of the grid
  """
  (N, H, W, C) = Xs.shape
  grid_size = int(ceil(sqrt(N)))
  grid_height = H * grid_size + padding * (grid_size - 1)
  grid_width = W * grid_size + padding * (grid_size - 1)
  grid = np.zeros((grid_height, grid_width, C))
  next_idx = 0
  y0, y1 = 0, H
  for y in xrange(grid_size):
    x0, x1 = 0, W
    for x in xrange(grid_size):
      if next_idx < N:
        img = Xs[next_idx]
        low, high = np.min(img), np.max(img)
        grid[y0:y1, x0:x1] = ubound * (img - low) / (high - low)
        # grid[y0:y1, x0:x1] = Xs[next_idx]
        next_idx += 1
      x0 += W + padding
      x1 += W + padding
    y0 += H + padding
    y1 += H + padding
  return grid

def visualize_grid1(Xs, ubound=255.0, padding=1):
  """
  Reshape a 4D tensor of image data to a grid for easy visualization.

  Inputs:
  - Xs: Data of shape (N, H, W)
  - ubound: Output grid will have values scaled to the range [0, ubound]
  - padding: The number of blank pixels between elements of the grid
  """
  (N, H, W) = Xs.shape
  grid_size = int(ceil(sqrt(N)))
  grid_height = H * grid_size + padding * (grid_size - 1)
  grid_width = W * grid_size + padding * (grid_size - 1)
  grid = np.zeros((grid_height, grid_width))
  next_idx = 0
  y0, y1 = 0, H
  for y in xrange(grid_size):
    x0, x1 = 0, W
    for x in xrange(grid_size):
      if next_idx < N:
        img = Xs[next_idx]
        low, high = np.min(img), np.max(img)
        grid[y0:y1, x0:x1] = ubound * (img - low) / (high - low)
        # grid[y0:y1, x0:x1] = Xs[next_idx]
        next_idx += 1
      x0 += W + padding
      x1 += W + padding
    y0 += H + padding
    y1 += H + padding
  return grid

def vis_grid(Xs):
  """ visualize a grid of images """
  (N, H, W, C) = Xs.shape
  A = int(ceil(sqrt(N)))
  G = np.ones((A*H+A, A*W+A, C), Xs.dtype)
  G *= np.min(Xs)
  n = 0
  for y in range(A):
    for x in range(A):
      if n < N:
        G[y*H+y:(y+1)*H+y, x*W+x:(x+1)*W+x, :] = Xs[n,:,:,:]
        n += 1
  # normalize to [0,1]
  maxg = G.max()
  ming = G.min()
  G = (G - ming)/(maxg-ming)
  return G

def vis_nn(rows):
  """ visualize array of arrays of images """
  N = len(rows)
  D = len(rows[0])
  H,W,C = rows[0][0].shape
  Xs = rows[0][0]
  G = np.ones((N*H+N, D*W+D, C), Xs.dtype)
  for y in range(N):
    for x in range(D):
      G[y*H+y:(y+1)*H+y, x*W+x:(x+1)*W+x, :] = rows[y][x]
  # normalize to [0,1]
  maxg = G.max()
  ming = G.min()
  G = (G - ming)/(maxg-ming)
  return G
# -*- coding: utf-8 -*-
"""
Created on Sat May 20 10:55:11 2017

@author: Abner
"""

import numpy as np
import matplotlib.pyplot as plt
import matplotlib

matplotlib.use('Agg')

from vis_uitls import visualize_grid
from vis_uitls import visualize_grid1
from LoadData import Load_CIFAR10
from Load_MNIST import Load_MNIST_Data
from Fullc_NN import TwoLayerNet

#matplotlib inline
plt.rcParams['figure.figsize'] = (10.0, 8.0) # set default size of plots
plt.rcParams['image.interpolation'] = 'nearest'
plt.rcParams['image.cmap'] = 'gray'

# for auto-reloading external modules
# see http://stackoverflow.com/questions/1907993/autoreload-of-modules-in-ipython
#%load_ext autoreload
#%autoreload 2

#读取MNIST数据集
##############################################################################
def get_MNIST_data(num_training=59000, num_validation=1000, num_test=1000):
    """
    Load the CIFAR-10 dataset from disk and perform preprocessing to prepare
    it for the two-layer neural net classifier. These are the same steps as
    we used for the SVM, but condensed to a single function.
    """
    # Load the raw CIFAR-10 data
    X_train, y_train, X_test, y_test = Load_MNIST_Data()
    X_train = X_train.reshape(60000, 28, 28)
    X_test = X_test.reshape(10000, 28, 28)
    print "Before reshape Data:"
    print "X_train: ", X_train.shape
    print "y_train: ", y_train.shape
    print "X_test: ", X_test.shape
    print "y_test: ", y_test.shape

    # Subsample the data
    mask = range(num_training, num_training + num_validation)
    X_val = X_train[mask]
    y_val = y_train[mask]
    mask = range(num_training)
    X_train = X_train[mask]
    y_train = y_train[mask]
    mask = range(num_test)
    X_test = X_test[mask]
    y_test = y_test[mask]


    # Normalize the data: subtract the mean image
    mean_image = np.mean(X_train, axis=0)
    X_train = X_train - mean_image
    X_val = X_val - mean_image
    X_test = X_test - mean_image

    # Reshape data to rows
    X_train = X_train.reshape(num_training, -1)
    X_val = X_val.reshape(num_validation, -1)
    X_test = X_test.reshape(num_test, -1)


    return X_train, y_train, X_val, y_val, X_test, y_test

    ##########################################################################

'''
def get_CIFAR10_data(num_training=49000, num_validation=1000, num_test=1000):
    """
    Load the CIFAR-10 dataset from disk and perform preprocessing to prepare
    it for the two-layer neural net classifier. These are the same steps as
    we used for the SVM, but condensed to a single function.
    """
    # Load the raw CIFAR-10 data
    cifar10_dir = 'cifar-10-batches-py'
    X_train, y_train, X_test, y_test = Load_CIFAR10(cifar10_dir)
    print "Before reshape Data:"
    print "X_train: ", X_train.shape
    print "y_train: ", y_train.shape
    print "X_test: ", X_test.shape
    print "y_test: ", y_test.shape

    # Subsample the data
    mask = range(num_training, num_training + num_validation)
    X_val = X_train[mask]
    y_val = y_train[mask]
    mask = range(num_training)
    X_train = X_train[mask]
    y_train = y_train[mask]
    mask = range(num_test)
    X_test = X_test[mask]
    y_test = y_test[mask]

    # Normalize the data: subtract the mean image
    mean_image = np.mean(X_train, axis=0)
    X_train -= mean_image
    X_val -= mean_image
    X_test -= mean_image

    # Reshape data to rows
    X_train = X_train.reshape(num_training, -1)
    X_val = X_val.reshape(num_validation, -1)
    X_test = X_test.reshape(num_test, -1)


    return X_train, y_train, X_val, y_val, X_test, y_test

'''
# Invoke the above function to get our data.
#X_train, y_train, X_val, y_val, X_test, y_test = get_CIFAR10_data()

#MNIST
X_train, y_train, X_val, y_val, X_test, y_test = get_MNIST_data()

print 'Train data shape: ', X_train.shape
print 'Train labels shape: ', y_train.shape
print 'Validation data shape: ', X_val.shape
print 'Validation labels shape: ', y_val.shape
print 'Test data shape: ', X_test.shape
print 'Test labels shape: ', y_test.shape


'''
##############################################################################
"""
不经过寻参,隐藏层设置神经元个数为50个
"""

#输入层神经元的个数是数据的维数,隐藏层神经元的个数为50个,输出层神经元的个数为10个
#input_size = 32 * 32 * 3
input_size = 28*28
hidden_size = 50
num_classes = 10
net = TwoLayerNet(input_size, hidden_size, num_classes)

# Train the network
stats = net.train(X_train, y_train, X_val, y_val,
            num_iters=1000, batch_size=200,
            learning_rate=1e-4, learning_rate_decay=0.95,
            reg=0.5, verbose=True)

# Predict on the validation set
val_acc = (net.predict(X_val) == y_val).mean()
print 'Validation accuracy: ', val_acc

plt.subplot(2, 1, 1)
plt.plot(stats['loss_history'])
plt.title('Loss history')
plt.xlabel('Iteration')
plt.ylabel('Loss')

plt.subplot(2, 1, 2)
train_acc, = plt.plot(stats['train_acc_history'], label='train')
val_acc, = plt.plot(stats['val_acc_history'], label='val')
plt.legend([train_acc, val_acc], ['Training Accuracy', 'Validation Accuracy'], loc='lower right')
plt.title('Classification accuracy history')
plt.xlabel('Epoch')
plt.ylabel('Clasification accuracy')
#plt.show()
plt.savefig('E:\\MNIST\\loss.jpg')

plt.close()

#def show_net_weights(net):
#  W1 = net.params['W1']
#  W1 = W1.reshape(32, 32, 3, -1).transpose(3, 0, 1, 2)
#  plt.imshow(visualize_grid(W1, padding=3).astype('uint8'))
#  plt.gca().axis('off')
##  plt.show()
#  plt.savefig('E:\\MNIST\\weight.jpg')

def show_net_weights(net):
  W1 = net.params['W1']
  W1 = W1.reshape(28, 28, -1).transpose(2, 0, 1)
  plt.imshow(visualize_grid1(W1, padding=1).astype('uint8'))
  plt.gca().axis('off')
#  plt.show()
  plt.savefig('E:\\MNIST\\weight.jpg')
show_net_weights(net)

##############################################################################
'''


# best_net = None # store the best model into this

#################################################################################
# TODO: Tune hyperparameters using the validation set. Store your best trained  #
# model in best_net.                                                            #
#                                                                               #
# To help debug your network, it may help to use visualizations similar to the  #
# ones we used above; these visualizations will have significant qualitative    #
# differences from the ones we saw above for the poorly tuned network.          #
#                                                                               #
# Tweaking hyperparameters by hand can be fun, but you might find it useful to  #
# write code to sweep through possible combinations of hyperparameters          #
# automatically like we did on the previous exercises.                          #
#################################################################################

stats = {}
results = {}
best_val = -1
best_stats = None

#input_size = 32 * 32 * 3
input_size = 28*28
num_classes = 10

# hidden_sizes = (100 * np.random.rand(5)).round().astype(int)
# learning_rates = (5e-3 - 5e-5) * np.random.rand(5) + 5e-5
# regularization_strengths = np.random.rand(5)

# hidden_sizes = [50, 75, 100]
# learning_rates = [5e-4]
# regularization_strengths = [0.65, 0.75, 0.85]

# hidden_sizes = np.round(10 ** np.random.uniform(1.7,2.3,3)).astype(int)
#hidden_sizes = [100]

#CIFAR10
#def show_net_weights(net, k):
#  W1 = net.params['W1']
#  W1 = W1.reshape(32, 32, 3, -1).transpose(3, 0, 1, 2)
#  plt.imshow(visualize_grid(W1, padding=3).astype('uint8'))
#  plt.gca().axis('off')
#  plt.savefig('E:\\NN\\%d times_W.jpg' % k)
#  plt.show()

def show_net_weights(net, k):
  W1 = net.params['W1']
  W1 = W1.reshape(28, 28, -1).transpose(2, 0, 1)
  plt.imshow(visualize_grid1(W1, padding=1).astype('uint8'))
  plt.gca().axis('off')
  plt.savefig('E:\\MNIST\\%d times_W1.jpg' % k)


hidden_sizes = [50, 75, 100]
learning_rates = 10 ** np.random.uniform(-3.5,-2.5,5)
regularization_strengths = 10 ** np.random.uniform(-5,1,5)

k = 0
for hidden_size in hidden_sizes:

    for learning_rate in learning_rates:

        for regularization_strength in regularization_strengths:

            # Print hyperparameters
            print 'Size = %d, Learning rate = %e, Reg. Strength = %e' % (
                hidden_size, learning_rate, regularization_strength)

            # Initialize net
            net = TwoLayerNet(input_size, hidden_size, num_classes)

            # Training
            stats[hidden_size, learning_rate, regularization_strength] = \
                net.train(X_train, y_train, X_val, y_val,
                          num_iters=2000, batch_size=500,
                          learning_rate=learning_rate, learning_rate_decay=0.95,
                          reg=regularization_strength, verbose=True)

            # Testing
            y_train_pred = net.predict(X_train)
            y_val_pred = net.predict(X_val)

            # Evaluation
            train_num_correct = np.sum(y_train_pred == y_train)
            training_accuracy = float(train_num_correct) / X_train.shape[0]

            val_num_correct = np.sum(y_val_pred == y_val)
            validation_accuracy = float(val_num_correct) / X_val.shape[0]

            results[hidden_size, learning_rate, regularization_strength] = training_accuracy, validation_accuracy

            if validation_accuracy > best_val:
                best_val = validation_accuracy
                best_net = net
                best_stats = stats[hidden_size, learning_rate, regularization_strength]

            current_stats = stats[hidden_size, learning_rate, regularization_strength]

            # Plot the loss function and train / validation accuracies
            plt.subplot(2, 1, 1)
            plt.plot(current_stats['loss_history'])
            plt.title('Loss history')
            plt.xlabel('Iteration')
            plt.ylabel('Loss')

            plt.subplot(2, 1, 2)
            train_acc, = plt.plot(current_stats['train_acc_history'], label='train')
            val_acc, = plt.plot(current_stats['val_acc_history'], label='val')
            plt.legend([train_acc, val_acc], ['Training Accuracy', 'Validation Accuracy'], loc = 'lower right')
            plt.title('Classification accuracy history')
            plt.xlabel('Epoch')#寻参的时候,每次训练时,验证集和训练集的正确率
            plt.ylabel('Clasification accuracy')
#            plt.show()
            k += 1
            plt.savefig('E:\\MNIST\\%d times_Loss.jpg' % (k))
            # visualize the weights of the current network
            plt.close()
            print "第%d次寻参的权重" % k
            show_net_weights(net, k)

pass

# Print out results.
for hid_size, lr, reg in sorted(results):
    train_accuracy, val_accuracy = results[(hid_size, lr, reg)]
    print 'size %d lr %e reg %e train accuracy: %f val accuracy: %f' % (
                hid_size, lr, reg, train_accuracy, val_accuracy)

print 'best validation accuracy achieved during cross-validation: %f' % best_val

plt.close()
# Plot the loss function and train / validation accuracies
plt.subplot(2, 1, 1)
plt.plot(best_stats['loss_history'])
plt.title('Loss history')
plt.xlabel('Iteration')
plt.ylabel('Loss')

plt.subplot(2, 1, 2)
train_acc, = plt.plot(best_stats['train_acc_history'], label='train')
val_acc, = plt.plot(best_stats['val_acc_history'], label='val')
plt.legend([train_acc, val_acc], ['Training Accuracy', 'Validation Accuracy'], loc = 'lower right')
plt.title('Classification accuracy history')
plt.xlabel('Epoch')
plt.ylabel('Clasification accuracy')
#plt.show()
plt.savefig('E:\\MNIST\\Best_Loss.jpg')
plt.close()

# visualize the weights of the current network
print "最优时候的权重:"
show_net_weights(best_net, 0)

pass
#################################################################################
#                               END OF YOUR CODE                                #
#################################################################################

#test_acc = (best_net.predict(X_test) == y_test).mean()
#print 'Test accuracy: ', test_acc


test_acc = (best_net.predict(X_test) == y_test).mean()
print 'Test accuracy: ', test_acc
