python可视化:一些常用绘图脚本
个人整理的一些常用的绘图脚本,基于python的可视化库: matplotlib和seaborn。
1. BARPLOT
fig = plt.figure(figsize=(12,8))
ax = fig.add_subplot(1,1,1)
a = [0.91, 2.29, 3]
b = [1.73, 1.99, 4]
c = [2.12, 1.26, 5]
xx = np.array(list(range(3)))
l2 = ax.bar(xx-0.3, a, color='mediumseagreen',align='edge',width=0.2,label='a',yerr=0.1)
l1 = ax.bar(xx-0.1, b, color='indianred',align='edge',width=0.2,label='b',yerr=0.2)
l3 = ax.bar(xx+0.1, c, color='steelblue',align='edge',width=0.2,label='c',yerr=0.3)
ax.set_title("TITLE", fontsize=25, pad=5)
ax.legend(handles=[l1,l2,l3, ], loc=0, ncol=1, fontsize=15, framealpha=0.3)
ax.tick_params(labelcolor='k', labelsize=20, width=3)
# fig.tight_layout() # 调整整体空白
# plt.subplots_adjust(wspace=0.05, hspace=0.15)  # 调整子图间距
plt.xticks([0,1,2], ['label_1','label_2','label_3'])
plt.show()
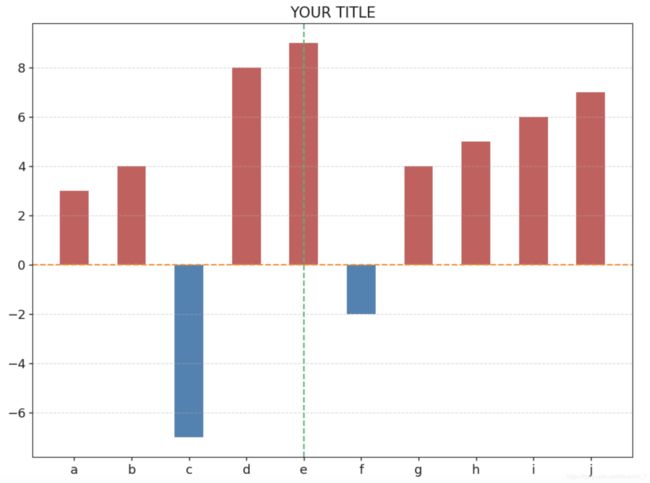
2. BARPLOT按值区分颜色及画水平、垂直参考线
a = np.array(['a', 'b', 'c', 'd', 'e', 'f', 'g', 'h', 'i', 'j'])
b = np.array([3, 4, -7, 8, 9, -2, 4, 5, 6, 7])
colors = np.where(b > 0, 'indianred', 'steelblue')
fig = plt.figure(figsize=(11, 8), dpi=100)
ax1 = fig.add_subplot(111)
ax1.bar(a, b, color=colors, width=0.5)
ax1.tick_params(labelcolor='k', labelsize='13', width=1)
ax1.axhline(0,c='darkorange',linestyle='--') # 画水平参考线
ax1.axvline('e',c='mediumseagreen',linestyle='--') # 画水平参考线
ax1.set_title("YOUR TITLE", fontsize=15)
# fig.tight_layout() # 调整整体空白
# plt.subplots_adjust(wspace=0, hspace=0.40)  # 调整子图间距
# plt.xticks(rotation=0)
plt.grid(axis='y', linestyle='--', alpha=0.5)
plt.show()
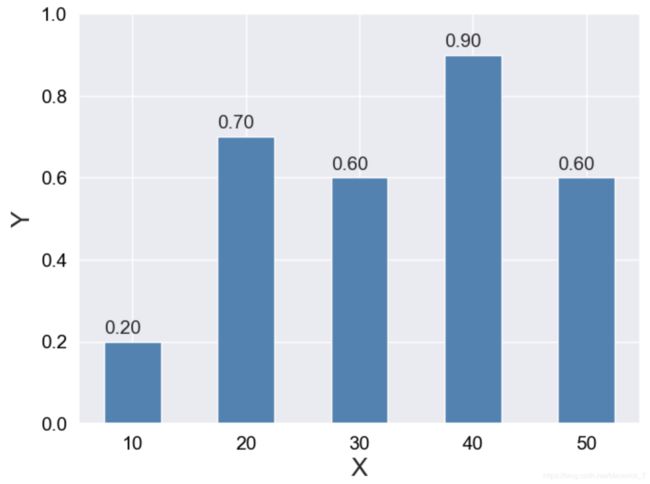
3. BARPLOT标注数值
x_bar = [10, 20, 30, 40, 50]
y_bar = [0.2, 0.7, 0.6, 0.9, 0.6]
# 画图:
plt.figure(figsize=(8, 6), dpi=100)  # 设置画图大小和分辨率
bars = plt.bar(x_bar, y_bar, color='steelblue', label=x_bar, width=5)
# 在柱状图上标注数值:
for i, rec in enumerate(bars):
    x_text = rec.get_x()  # 获取柱形图横坐标 可以+/-数值使其居中
    y_text = rec.get_height() + 0.02  # 获取柱子的高度 +0.02
    plt.text(x_text, y_text, '%.2f' % y_bar[i], fontsize=15)  # 标注文字
# 坐标轴设置:
plt.ylim((0, 1))   # y取值范围
plt.xlabel('X', fontsize=20)  # x标签
plt.ylabel('Y', fontsize=20)  # y标签
plt.tick_params(labelcolor='black', labelsize='15', width=1)
plt.show()
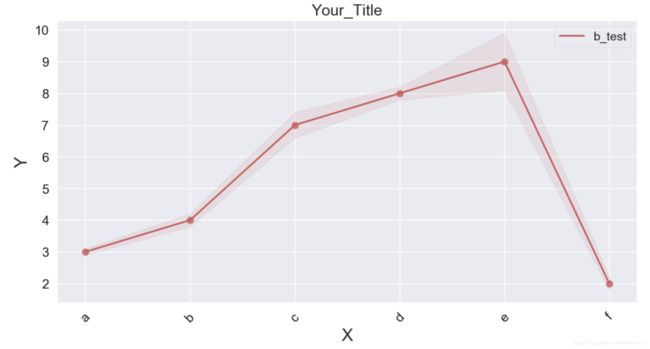
4. LINEPLOT
a = np.array(['a','b','c','d','e','f'])
b = np.array([3,4,7,8,9,2])
std = np.array([0.1,0.2,0.4,0.2,0.9,0.2])
fig = plt.figure(figsize=(12, 6), dpi=100)
ax1 = fig.add_subplot(111)
l1, = ax1.plot(a, b, c='indianred', label='b_test',lw=2)
ax1.scatter(a, b, c='indianred',lw=2.5,alpha=0.7)
ax1.fill_between(a, b-std, b+std,alpha=0.1,color='indianred')
ax1.tick_params(labelcolor='k', labelsize='15', width=3)
ax1.legend(handles=[l1, ], loc=0, ncol=2, fontsize=14, framealpha=0.3)
ax1.set_title("Your_Title", fontsize=18)
ax1.set_xlabel('X',fontsize=20)  # x标签
ax1.set_ylabel('Y',fontsize=20)  # x标签
plt.xticks(rotation=45)
plt.show()
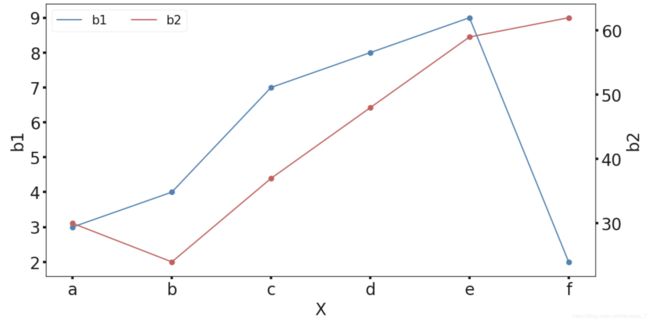
5. 双y轴
a = np.array(['a','b','c','d','e','f'])
b1 = np.array([3,4,7,8,9,2])
b2 = np.array([30,24,37,48,59,62])
# sns.set()
# sns.reset_orig()
fig = plt.figure(figsize=(12,6), dpi=100)
ax1 = fig.add_subplot(111)
l1, = ax1.plot(a,b1,c='steelblue')
ax1.scatter(a,b1,c='steelblue')
ax2 = ax1.twinx() # 双y轴
l2, = ax2.plot(a,b2,c='indianred')
ax2.scatter(a,b2,c='indianred') # lw=5,alpha=0.7
ax1.tick_params(labelcolor='k', labelsize='20', width=3)
ax1.set_ylabel("b1",fontsize=20)
ax2.tick_params(labelcolor='k', labelsize='20', width=3)
ax2.set_ylabel("b2",fontsize=20, rotation=90)
ax1.set_xlabel('X', fontsize=20)  # x标签
# plt.grid()
plt.legend(handles=[l1,l2],labels=['b1','b2'],loc='best',prop={'size': 15},ncol=2,framealpha=0.3)
plt.show()
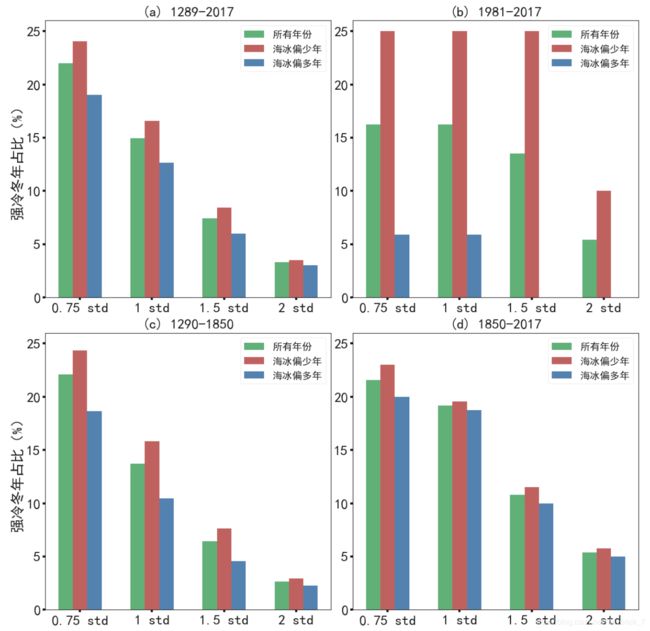
6. 多子图样例1
import numpy as np
import matplotlib.pyplot as plt
plt.rcParams['font.sans-serif']=['SimHei'] #用来正常显示中文标签
plt.rcParams['axes.unicode_minus']=False  #用来正常显示负号

### Data:
#1290-2017
a1=(21.98, 14.97, 7.42, 3.30)
a2=(24.07, 16.59, 8.41, 3.50)
a3=(19.,   12.67, 6.,   3.  )
#1290-1850
b1=(22.10,  13.73,  6.42,  2.67)
b2=(24.34,  15.84,  7.62,  2.93)
b3=(18.64,  10.45,  4.55,  2.27)
#1850-2017
c1=(21.56,  19.16,  10.78,  5.39)
c2=(22.99,  19.54 , 11.49,  5.75)
c3=(20.  ,  18.75,  10.  ,  5.  )
#1981-2017
d1=(16.22, 16.22,  13.51,  5.41)
d2=(25.,   25., 25.,  10.)
d3=(5.88,  5.88, 0.,  0.)

### Plot:
ind = np.arange(4)  # the x locations for the groups
width = 0.2  # the width of the bars

fig, ax = plt.subplots(2,2,figsize=(15, 15),dpi=100)

rects1 = ax[0,0].bar(ind - 0.2, a1, width, color='mediumseagreen', label='所有年份')
rects2 = ax[0,0].bar(ind , a2, width, color='IndianRed', label='海冰偏少年')
rects3 = ax[0,0].bar(ind + 0.2, a3, width, color='steelblue', label='海冰偏多年')

# Add some text for labels, title and custom x-axis tick labels, etc.
ax[0,0].set_ylabel(u'强冷冬年占比(%)',fontsize=20)
ax[0,0].set_title('(a) 1289-2017',fontsize=20)
ax[0,0].set_xticks(ind)
ax[0,0].set_xticklabels(('0.75 std', '1 std', '1.5 std', '2 std'),fontsize=20)
ax[0,0].legend(loc=0,prop={'size': 14},framealpha=0.3)
ax[0,0].tick_params(labelcolor='k', labelsize='20', width=3)
ax[0,0].set_ylim(0,26)

rects1 = ax[0,1].bar(ind - 0.2, d1, width, color='mediumseagreen', label='所有年份')
rects2 = ax[0,1].bar(ind , d2, width, color='IndianRed', label='海冰偏少年')
rects3 = ax[0,1].bar(ind + 0.2, d3, width, color='steelblue', label='海冰偏多年')
# Add some text for labels, title and custom x-axis tick labels, etc.
# ax[0,1].set_ylabel(u'强冷冬年占比(%)',fontsize=20)
ax[0,1].set_title('(b) 1981-2017',fontsize=20)
ax[0,1].set_xticks(ind)
ax[0,1].set_xticklabels(('0.75 std', '1 std', '1.5 std', '2 std'),fontsize=20)
ax[0,1].legend(loc=0,prop={'size': 14},framealpha=0.3)
ax[0,1].tick_params(labelcolor='k', labelsize='20', width=3)
ax[0,1].set_ylim(0,26)

rects1 = ax[1,0].bar(ind - 0.2, b1, width, color='mediumseagreen', label='所有年份')
rects2 = ax[1,0].bar(ind , b2, width, color='IndianRed', label='海冰偏少年')
rects3 = ax[1,0].bar(ind + 0.2, b3, width, color='steelblue', label='海冰偏多年')
# Add some text for labels, title and custom x-axis tick labels, etc.
ax[1,0].set_ylabel(u'强冷冬年占比(%)',fontsize=20)
ax[1,0].set_title('(c) 1290-1850',fontsize=20)
ax[1,0].set_xticks(ind)
ax[1,0].set_xticklabels(('0.75 std', '1 std', '1.5 std', '2 std'),fontsize=20)
ax[1,0].legend(loc=0,prop={'size': 14},framealpha=0.3)
ax[1,0].tick_params(labelcolor='k', labelsize='20', width=3)
ax[1,0].set_ylim(0,26)

rects1 = ax[1,1].bar(ind - 0.2, c1, width, color='mediumseagreen', label='所有年份')
rects2 = ax[1,1].bar(ind , c2, width, color='IndianRed', label='海冰偏少年')
rects3 = ax[1,1].bar(ind + 0.2, c3, width, color='steelblue', label='海冰偏多年')
# Add some text for labels, title and custom x-axis tick labels, etc.
# ax[3].set_ylabel(u'强冷冬年占比(%)',fontsize=20)
ax[1,1].set_title('(d) 1850-2017',fontsize=20)
ax[1,1].set_xticks(ind)
ax[1,1].set_xticklabels(('0.75 std', '1 std', '1.5 std', '2 std'),fontsize=20)
ax[1,1].legend(loc=0,prop={'size': 14},framealpha=0.3)
ax[1,1].tick_params(labelcolor='k', labelsize='20', width=3)
ax[1,1].set_ylim(0,26)
# ax[1,1].set_yticks([-1,0,1])

plt.subplots_adjust(hspace =0.128)
plt.subplots_adjust(wspace =0.078)
plt.show()
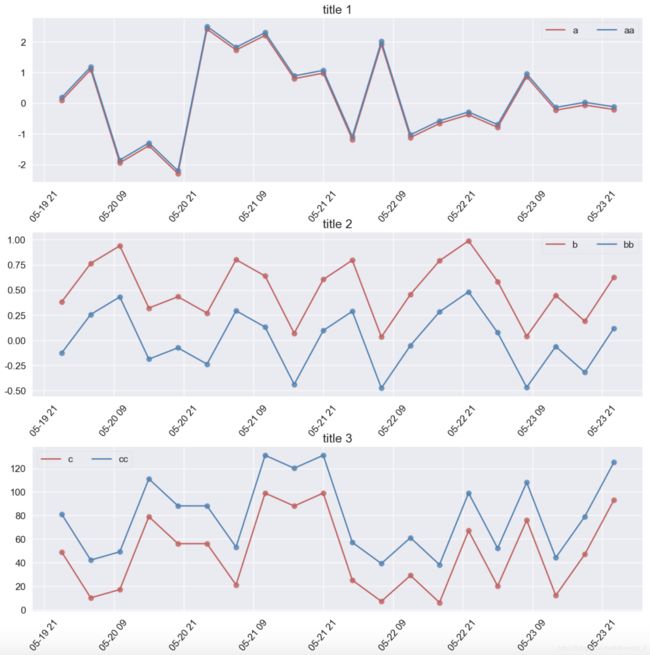
7. 多子图样例2
import seaborn as sns
import matplotlib.pyplot as plt
import numpy as np
import pandas as pd
%matplotlib inline

sns.set()

# make data
np.random.seed(8)
df_metric = pd.DataFrame()
a = np.random.randn(20)
aa = a + a.mean()
b = np.random.rand(20)
bb = b - b.mean()
c = np.random.randint(1,100,20)
cc = c + c.std()
inx_date = pd.date_range('2019-05-20 00:00:00',periods=20,freq='5H')
df_metric['a'] = a
df_metric['aa'] = aa
df_metric['b'] = b
df_metric['bb'] = bb
df_metric['c'] = c
df_metric['cc'] = cc
df_metric.index = inx_date

# plot
fig = plt.figure(figsize=(16,16), dpi=100)
ax1 = fig.add_subplot(311)
l1, = ax1.plot(df_metric.index, df_metric['a'], c='indianred', label='a',lw=2)
l2, = ax1.plot(df_metric.index, df_metric['aa'], c='steelblue', label='aa',lw=2)
ax1.scatter(df_metric.index, df_metric['a'], c='indianred',lw=2.5,alpha=0.7)
ax1.scatter(df_metric.index, df_metric['aa'], c='steelblue',lw=2.5,alpha=0.7)
ax1.tick_params(labelcolor='k', labelsize='13', width=3)
plt.xticks(rotation=50)
ax1.legend(handles=[l1, l2, ], loc=0, ncol=2,fontsize=14, framealpha=0.3)
ax1.tick_params(labelsize=14)
ax1.set_title("title 1", fontsize=18)

ax2 = fig.add_subplot(312)
l4, = ax2.plot(df_metric.index, df_metric['b'], c='indianred', label='b',lw=2)
l5, = ax2.plot(df_metric.index, df_metric['bb'], c='steelblue', label='bb',lw=2)
ax2.scatter(df_metric.index, df_metric['b'], c='indianred',lw=2.5,alpha=0.7)
ax2.scatter(df_metric.index, df_metric['bb'], c='steelblue',lw=2.5,alpha=0.7)
ax2.tick_params(labelcolor='k', labelsize='13', width=3)
plt.xticks(rotation=50)
ax2.legend(handles=[l4, l5, ], loc=0, ncol=2,fontsize=14, framealpha=0.3)
ax2.set_title("title 2", fontsize=18)
ax2.tick_params(labelsize=14)

ax3 = fig.add_subplot(313)
l7, = ax3.plot(df_metric.index, df_metric['c'], c='indianred', label='c',lw=2)
l8, = ax3.plot(df_metric.index, df_metric['cc'], c='steelblue', label='cc',lw=2)
ax3.scatter(df_metric.index, df_metric['c'], c='indianred',lw=2.5,alpha=0.7)
ax3.scatter(df_metric.index, df_metric['cc'], c='steelblue',lw=2.5,alpha=0.7)
ax3.tick_params(labelcolor='k', labelsize='13', width=3)
ax3.legend(handles=[l7, l8, ], loc=0, ncol=2, fontsize=14, framealpha=0.3)
ax3.set_title("title 3", fontsize=18)
# fig.tight_layout() # 调整整体空白
ax3.tick_params(labelsize=14)
plt.subplots_adjust(wspace=0, hspace=0.3)  # 调整子图间距
plt.xticks(rotation=50)
plt.show()
8. small multiples
plt.rcParams['font.sans-serif'] = [u'SimHei'] # 或其他系统有的字体,比如: ['Microsoft YaHei']
plt.rcParams['axes.unicode_minus'] = False  # 用来正常显示负号

# make data
dict_raw = {'col_a': {0: 'TYPE0S8', 1: 'TYPE1P7', 2: 'TYPE1S0', 3: 'TYPE1SS', 4: 'TYPE70P', 5: 'TYPE703',
                      6: 'TYPE707', 7: 'TYPE736', 8: 'TYPE753', 9: 'TYPE755', 10: 'TYPE813', 11: 'TYPE8P1',
                      12: 'TYPE8PP', 13: 'TYPE90S', 14: 'TYPE908', 35: 'TYPE0S8', 36: 'TYPE1P7', 37: 'TYPE1S0',
                      38: 'TYPE1SS', 39: 'TYPE70P', 40: 'TYPE703', 41: 'TYPE707', 42: 'TYPE736', 43: 'TYPE753',
                      44: 'TYPE755', 45: 'TYPE813', 46: 'TYPE8P1', 47: 'TYPE8PP', 48: 'TYPE90S', 49: 'TYPE908'},
            'col_b': {0: '9月', 1: '9月', 2: '9月', 3: '9月', 4: '9月', 5: '9月', 6: '9月', 7: '9月', 8: '9月',
                      9: '9月', 10: '9月', 11: '9月', 12: '9月', 13: '9月', 14: '9月', 35: '10月', 36: '10月',
                      37: '10月', 38: '10月', 39: '10月', 40: '10月', 41: '10月', 42: '10月', 43: '10月', 44: '10月',
                      45: '10月', 46: '10月', 47: '10月', 48: '10月', 49: '10月'},
            'col_c': {0: 2.6428601514360017, 1: 1.8319798053011773, 2: 2.601229123057832, 3: 1.72169662572525,
                      4: 1.637656679935968, 5: 2.6350520642062403, 6: 2.2498173621928217, 7: 2.298807428556654,
                      8: 1.9654078492733291, 9: 2.56251943219609, 10: 2.1881414261088743, 11: 2.40588210634869,
                      12: 2.4080364119992685, 13: 2.418858600226157, 14: 2.275355095895594, 35: 2.6302242713734163,
                      36: 2.749858196921841, 37: 2.6632009348161807, 38: 3.1462676552066275, 39: 2.9537594325705214,
                      40: 2.194474507822355, 41: 2.9186372365641944, 42: 3.7921705624244755, 43: 3.046406643811439,
                      44: 3.0391317507811673, 45: 2.4109368543025282, 46: 2.07482417438061, 47: 3.0976472954696685,
                      48: 2.7432562987349196, 49: 2.0569511603235604},
            'col_d': {0: 1.9812875781312758, 1: 2.096699560700066, 2: 2.2816854661768877, 3: 2.8931088754456313,
                      4: 2.0294500573338676, 5: 2.580210383486994, 6: 2.5804163915356066, 7: 2.5516185895623527,
                      8: 2.354802917894336, 9: 2.6357998623211003, 10: 2.6791760036089585, 11: 2.7300954422777455,
                      12: 2.5956405590120353, 13: 2.3493458894314823, 14: 2.492005756633012, 35: 2.730489032968205,
                      36: 2.792451184984058, 37: 2.9411054743190674, 38: 3.3903275163409066, 39: 3.0930567552674715,
                      40: 3.2844194681423358, 41: 2.5416425128417184, 42: 3.08728983954736, 43: 3.5953189913850454,
                      44: 2.7328204558541556, 45: 2.815085801904495, 46: 2.388500586386029, 47: 2.398294142683776,
                      48: 2.631769697717314, 49: 2.2519270271606033}}

df_test = pd.DataFrame(dict_raw)

fig, axes = plt.subplots(nrows=3, ncols=5, sharex=True,
                         sharey=True, figsize=(20, 12))
plt.subplots_adjust(wspace=0.07, hspace=0.07)  # 调整子图间距
id_lst = df_test['col_a'].unique()

for i in range(3):
    for j in range(5):
        idx_id = i*5+j
        xid = id_lst[idx_id]
        df_metric = df_test.loc[df_test['col_a'] == xid, :]
        df_metric = df_metric.reset_index(drop=True)
        l1 = axes[i, j].bar(df_metric.index-0.15, df_metric['col_c'],
                            color='darkorange', width=0.3, label='c')
        l2 = axes[i, j].bar(df_metric.index+0.15, df_metric['col_d'],
                            color='steelblue', width=0.3, label='d')

        axes[i, j].set_title(f"Title {i,j}", fontsize=18, pad=8)
        axes[i, j].legend(handles=[l1, l2, ], loc=0, ncol=2,
                          fontsize=13, framealpha=0.3)
        axes[i, j].tick_params(labelcolor='k', labelsize=20, width=3)
        # 取消边框,使其不可见
        # axes[i,j].spines['top'].set_visible(False)
        # axes[i,j].spines['right'].set_visible(False)
        # axes[i,j].spines['bottom'].set_visible(False)
        # axes[i,j].spines['left'].set_visible(False)
        # 调整边框的颜色
        # axes[i,j].spines['top'].set_color('#C8C8C8')
        # axes[i,j].spines['right'].set_color('#C8C8C8')
        # axes[i,j].spines['bottom'].set_color('#C8C8C8')
        # axes[i,j].spines['left'].set_color('#C8C8C8')

fig.tight_layout()  # 调整整体空白
plt.subplots_adjust(wspace=0.05, hspace=0.15)  # 调整子图间距
plt.xticks(df_metric.index, df_metric['col_b'])

plt.show()
Reference
1. Python Graph Gallery

