将Matplotlib绘制的图显示到Tkinter中(详细教程)
参考文献:https://blog.csdn.net/SHU15121856/article/details/87307124
运行环境:win10、python3
用Matplotlib自定义绘制图形
三次贝塞尔曲线有四个控制点,曲线在起始点与1,2两个点相切,在结束点与3,4两个点相切。
from matplotlib.path import Path
from matplotlib.patches import PathPatch
from matplotlib import pyplot as plt

fig, ax = plt.subplots()

# 定义绘图指令与控制点坐标
path_data = [
    (Path.MOVETO, (0, 1)),  # 绘图起始点.从这里往后4个点控制一条3次贝塞尔曲线
    (Path.CURVE4, (-1, 1)),
    (Path.CURVE4, (-2, 3)),
    (Path.CURVE4, (-1, 2)),
    (Path.LINETO, (0, 2)),  # 绘制一条直线.从这里往后3个点控制一条2次贝塞尔曲线
    (Path.CURVE3, (1, 2)),
    (Path.CURVE3, (2, 3)),
    (Path.CLOSEPOLY, (0, 1))  # 最后一个点,结束绘制.这里让它等于第一个点也就是闭合了,才构成图形
]

# 序列解包再zip重组,将指令放在一起,坐标放在一起(得到两个元组)
codes, verts = zip(*path_data)  # 这里的等号也是一种序列解包,将[(),()]解成两个()

# 根据顶点和指令创建Path对象
path = Path(verts, codes)
# 根据Path对象创建图形对象
path_patch = PathPatch(path, facecolor='g', alpha=0.8)
# 将这个图形添加到图上
ax.add_patch(path_patch)

# 绘制控制点和连线
x, y = zip(*verts)
line, = ax.plot(x, y, 'bo-')  # blue,圆点,直线

ax.grid()

ax.axis('equal')  # 坐标轴刻度大小相等

plt.plot()
plt.show()
将Matplotlib绘制的图显示到Tkinter中
tkinter是python的一个GUI库,有时候PC端UI界面上需要显示复杂的图时候就会用到这点。
import tkinter
import numpy as np
from matplotlib.backends.backend_tkagg import FigureCanvasTkAgg, NavigationToolbar2Tk
from matplotlib.backend_bases import key_press_handler
from matplotlib.figure import Figure

root = tkinter.Tk()  # 创建tkinter的主窗口
root.title("在tkinter中使用matplotlib")

f = Figure(figsize=(5, 4), dpi=100)
a = f.add_subplot(111)  # 添加子图:1行1列第1个

# 生成用于绘sin图的数据
x = np.arange(0, 3, 0.01)
y = np.sin(2 * np.pi * x)

# 在前面得到的子图上绘图
a.plot(x, y)

# 将绘制的图形显示到tkinter:创建属于root的canvas画布,并将图f置于画布上
canvas = FigureCanvasTkAgg(f, master=root)
canvas.draw()  # 注意show方法已经过时了,这里改用draw
canvas.get_tk_widget().pack(side=tkinter.TOP,  # 上对齐
                            fill=tkinter.BOTH,  # 填充方式
                            expand=tkinter.YES)  # 随窗口大小调整而调整

# matplotlib的导航工具栏显示上来(默认是不会显示它的)
toolbar = NavigationToolbar2Tk(canvas, root)
toolbar.update()
canvas._tkcanvas.pack(side=tkinter.TOP,  # get_tk_widget()得到的就是_tkcanvas
                      fill=tkinter.BOTH,
                      expand=tkinter.YES)


def on_key_event(event):
    """键盘事件处理"""
    print("你按了%s" % event.key)
    key_press_handler(event, canvas, toolbar)


# 绑定上面定义的键盘事件处理函数
canvas.mpl_connect('key_press_event', on_key_event)


def _quit():
    """点击退出按钮时调用这个函数"""
    root.quit()  # 结束主循环
    root.destroy()  # 销毁窗口


# 创建一个按钮,并把上面那个函数绑定过来
button = tkinter.Button(master=root, text="退出", command=_quit)
# 按钮放在下边
button.pack(side=tkinter.BOTTOM)

# 主循环
root.mainloop()
import tkinter
import numpy as np
from matplotlib.backends.backend_tkagg import FigureCanvasTkAgg, NavigationToolbar2TkAgg
from matplotlib.backend_bases import key_press_handler
from matplotlib.figure import Figure

root = tkinter.Tk()  # 创建tkinter的主窗口
root.title("在tkinter中使用matplotlib")

f = Figure(figsize=(5, 4), dpi=100)
a = f.add_subplot(111)  # 添加子图:1行1列第1个

# 生成用于绘sin图的数据
x = np.arange(0, 3, 0.01)
y = np.sin(2 * np.pi * x)

# 在前面得到的子图上绘图
a.plot(x, y)

# 将绘制的图形显示到tkinter:创建属于root的canvas画布,并将图f置于画布上
canvas = FigureCanvasTkAgg(f, master=root)
canvas.draw()  # 注意show方法已经过时了,这里改用draw
canvas.get_tk_widget().pack(side=tkinter.TOP,  # 上对齐
                            fill=tkinter.BOTH,  # 填充方式
                            expand=tkinter.YES)  # 随窗口大小调整而调整

# matplotlib的导航工具栏显示上来(默认是不会显示它的)
toolbar = NavigationToolbar2TkAgg(canvas, root)
toolbar.update()
canvas._tkcanvas.pack(side=tkinter.TOP,  # get_tk_widget()得到的就是_tkcanvas
                      fill=tkinter.BOTH,
                      expand=tkinter.YES)


def on_key_event(event):
    """键盘事件处理"""
    print("你按了%s" % event.key)
    key_press_handler(event, canvas, toolbar)


# 绑定上面定义的键盘事件处理函数
canvas.mpl_connect('key_press_event', on_key_event)


def _quit():
    """点击退出按钮时调用这个函数"""
    root.quit()  # 结束主循环
    root.destroy()  # 销毁窗口


# 创建一个按钮,并把上面那个函数绑定过来
button = tkinter.Button(master=root, text="退出", command=_quit)
# 按钮放在下边
button.pack(side=tkinter.BOTTOM)

# 主循环
root.mainloop()
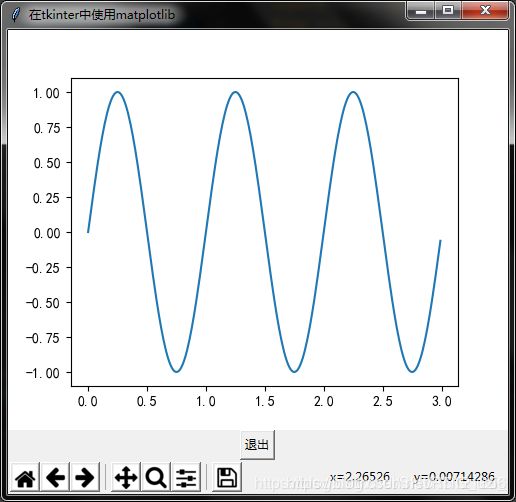
运行结果:

注意:NavigationToolbar2TkAgg已经被弃用了,使用python3.5.2中的命令为NavigationToolbar2Tk
例子2
import math
import numpy as np
#-------------------------------------------------------------------------------------------
import matplotlib
import matplotlib.pyplot as plt
from matplotlib.pylab import mpl
from matplotlib.backends.backend_tkagg import FigureCanvasTkAgg,NavigationToolbar2Tk #NavigationToolbar2TkAgg
#------------------------------------------------------------------------------------------
import tkinter as tk
#------------------------------------------------------------------------------------------


mpl.rcParams['font.sans-serif'] = ['SimHei']  #中文显示
mpl.rcParams['axes.unicode_minus']=False      #负号显示

class From:
    def __init__(self):
        self.root=tk.Tk()                    #创建主窗体
        self.canvas=tk.Canvas()              #创建一块显示图形的画布
        self.figure=self.create_matplotlib() #返回matplotlib所画图形的figure对象
        self.create_form(self.figure)        #将figure显示在tkinter窗体上面
        self.root.mainloop()

    def create_matplotlib(self):
        #创建绘图对象f
        f=plt.figure(num=2,figsize=(16,12),dpi=80,facecolor="pink",edgecolor='green',frameon=True)
        #创建一副子图
        fig1=plt.subplot(1,1,1)

        x=np.arange(0,2*np.pi,0.1)
        y1=np.sin(x)
        y2=np.cos(x)

        line1,=fig1.plot(x,y1,color='red',linewidth=3,linestyle='--')    #画第一条线
        line2,=fig1.plot(x,y2)
        plt.setp(line2,color='black',linewidth=8,linestyle='-',alpha=0.3)#华第二条线

        fig1.set_title("这是第一幅图",loc='center',pad=20,fontsize='xx-large',color='red')    #设置标题
        line1.set_label("正弦曲线")                                                           #确定图例
        fig1.legend(['正弦','余弦'],loc='upper left',facecolor='green',frameon=True,shadow=True,framealpha=0.5,fontsize='xx-large')

        fig1.set_xlabel('横坐标')                                                             #确定坐标轴标题
        fig1.set_ylabel("纵坐标")
        fig1.set_yticks([-1,-1/2,0,1/2,1])                                                   #设置坐标轴刻度
        fig1.grid(which='major',axis='x',color='r', linestyle='-', linewidth=2)              #设置网格

        return f

    def create_form(self,figure):
        #把绘制的图形显示到tkinter窗口上
        self.canvas=FigureCanvasTkAgg(figure,self.root)
        self.canvas.draw()  #以前的版本使用show()方法,matplotlib 2.2之后不再推荐show()用draw代替,但是用show不会报错,会显示警告
        self.canvas.get_tk_widget().pack(side=tk.TOP, fill=tk.BOTH, expand=1)

        #把matplotlib绘制图形的导航工具栏显示到tkinter窗口上
        toolbar =NavigationToolbar2Tk(self.canvas, self.root) #matplotlib 2.2版本之后推荐使用NavigationToolbar2Tk,若使用NavigationToolbar2TkAgg会警告
        toolbar.update()
        self.canvas._tkcanvas.pack(side=tk.TOP, fill=tk.BOTH, expand=1)

if __name__=="__main__":
    form=From()

