Python_一元线性回归及回归显著性
1、数据准备
数据源自《应用回归分析》(第四版)
## 火灾损失表
### 距离消防站km
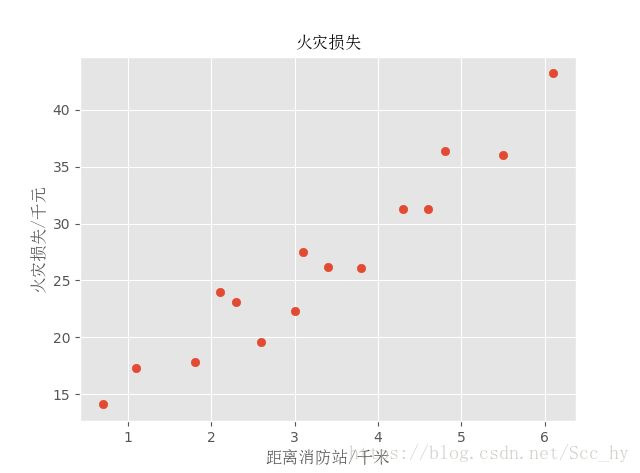
x = [3.4, 1.8, 4.6, 2.3, 3.1, 5.5, 0.7, 3.0, 2.6, 4.3, 2.1, 1.1, 6.1, 4.8, 3.8]
### 火灾损失 千元
y = [26.2, 17.8, 31.3, 23.1, 27.5, 36.0, 14.1, 22.3, 19.6, 31.3, 24.0, 17.3, 43.2, 36.4, 26.1]
绘制散点图观察基本趋势:
import matplotlib.pyplot as plt
plt.style.use('ggplot')
## 解决中文字符显示不全
from matplotlib.font_manager import FontProperties
font = FontProperties(fname=r"c:\windows\fonts\simsun.ttc", size=12)
plt.scatter(x, y)
plt.xlabel('距离消防站/千米',fontproperties = font)
plt.ylabel("火灾损失/千元",fontproperties = font)
plt.title('火灾损失',fontproperties = font)
plt.show()
2、sklearn大材小用线性回归
import numpy as np
from sklearn.linear_model import LinearRegression
x_in = np.array(x).reshape(-1,1)
y_in = np.array(y).reshape(-1,1)
lreg = LinearRegression()
lreg.fit(x_in, y_in)
y_prd = lreg.predict(x_in)
输出相关统计参数
#### 统计量参数
def get_lr_stats(x, y, model):
    message0 = '一元线性回归方程为: '+'\ty' + '=' + str(model.intercept_[0])+' + ' +str(model.coef_[0][0]) + '*x'
    from scipy import stats
    n     = len(x)
    y_prd = model.predict(x)
    Regression = sum((y_prd - np.mean(y))**2) # 回归
    Residual   = sum((y - y_prd)**2)          # 残差
    R_square   = Regression / (Regression + Residual) # 相关性系数R^2
    F          = (Regression / 1) / (Residual / ( n - 2 ))  # F 分布
    pf         = stats.f.sf(F, 1, n-2)
    message1 = ('相关系数(R^2): ' + str(R_square[0]) + ';' + '\n' +
                '回归分析(SSR): ' + str(Regression[0]) + ';' + '\t残差(SSE): ' +  str(Residual[0]) + ';' + '\n' +
                '           F : ' + str(F[0])  + ';' + '\t' + 'pf : '  + str(pf[0])   )
    ## T
    L_xx  =  n * np.var(x)
    sigma =  np.sqrt(Residual / n)
    t     =  model.coef_ * np.sqrt(L_xx) / sigma
    pt    =  stats.t.sf(t, n-2)
    message2 = '           t : ' + str(t[0][0])+ ';' +  '\t' + 'pt : '  + str(pt[0][0])
    return print(message0 +'\n' +message1 + '\n'+message2)

get_lr_stats(x_in, y_in, lreg)
结果如下
>>> get_lr_stats(x_in, y_in, lreg)
一元线性回归方程为:     y=10.277928549524688 + 4.91933072677093*x
相关系数(R^2): 0.9234781689805285;
回归分析(SSR): 841.7663579806808;     残差(SSE): 69.75097535265259;
           F : 156.88615963321718;    pf : 1.2478000079204313e-08
           t : 13.45445992541066;     pt : 2.6193260491226123e-09
2-1 同样也可以用statsmodels 来实现
from statsmodels.formula.api import ols
import pandas as pd
data = pd.DataFrame({'x':x, 'y':y})
model = ols('y~x', data).fit()
print(model.summary())
结果如下:
                            OLS Regression Results
==============================================================================
Dep. Variable:                      y   R-squared:                       0.923
Model:                            OLS   Adj. R-squared:                  0.918
Method:                 Least Squares   F-statistic:                     156.9
Date:                Mon, 24 Sep 2018   Prob (F-statistic):           1.25e-08
Time:                        20:56:18   Log-Likelihood:                -32.811
No. Observations:                  15   AIC:                             69.62
Df Residuals:                      13   BIC:                             71.04
Df Model:                           1
Covariance Type:            nonrobust
==============================================================================
                 coef    std err          t      P>|t|      [0.025      0.975]
------------------------------------------------------------------------------
Intercept     10.2779      1.420      7.237      0.000       7.210      13.346
x              4.9193      0.393     12.525      0.000       4.071       5.768
==============================================================================
Omnibus:                        2.551   Durbin-Watson:                   1.318
Prob(Omnibus):                  0.279   Jarque-Bera (JB):                1.047
Skew:                          -0.003   Prob(JB):                        0.592
Kurtosis:                       1.706   Cond. No.                         9.13
==============================================================================
3、scipy.interpolate图示线性回归效果
from scipy.interpolate import interp1d # 进行插值画图
linear_interp = interp1d(x, y_prd.transpose()[0], kind='linear')
computed = np.linspace(min(x),max(x) , 50)
linear_results = linear_interp(computed)

plt.scatter(x, y,s = 8, label = 'orignal data')
plt.scatter(x_in, y_prd,c = 'green', s = 9 ,  label = 'predict data')
plt.plot(computed, linear_results , label = 'linear_interp', alpha = 0.7, c = 'orange')
plt.xlabel('距离消防站/千米',fontproperties = font)
plt.ylabel("火灾损失/千元",fontproperties = font)
plt.title('火灾损失',fontproperties = font)
plt.ylim(0,50)
plt.legend(loc = 'upper left')
plt.show()
4、残差图
#### 残差图
def Residual_plot(x, y, model):
    from matplotlib.font_manager import FontProperties
    font = FontProperties(fname=r"c:\windows\fonts\simsun.ttc", size=12)
    message = ''
    ycout = '不存在异常值'
    n = len(x)
    y_prd = model.predict(x)
    e = y - y_prd
    sigama = np.std(e)
    ## ZRE 标准化残差
    zre = e / sigama
    ## SRE 学生化残差
    L_xx = n * np.var(x)
    hii = 1/n + (x - np.mean(x))/L_xx ## 杠杆值
    sre = e/(sigama*np.sqrt(1 - hii))
    if sum(sre > 3)[0]:
        ycout = x[sre>3], y[sre>3]
        message = '异常值: ' +str(ycout)
    else:
        message = '异常值: ' + ycout

    ## 绘图
    mx = max(x)[0] + 1
    plt.scatter(x, e, c = 'red', s= 6)
    plt.plot([0, mx],[2*sigama,2*sigama], 'k--', c='green')
    plt.plot([0, mx],[-2*sigama,-2*sigama], 'k--', c='green')
    plt.plot([0, mx],[3*sigama,3*sigama], 'k--', c='orange')
    plt.plot([0, mx],[-3*sigama,-3*sigama], 'k--', c='orange')
    plt.annotate(message, xy = (0, np.ceil(3*sigama+1)), xycoords = 'data',fontproperties = font)
    plt.xlim(0, mx)
    plt.ylim(-np.ceil(3*sigama+2), np.ceil(3*sigama+2))
    plt.show()
    return print(message)

Residual_plot(x_in, y_in, lreg)


