Django 图表制作(By Highcharts)
摘要:
Highcharts 是一个用纯 JavaScript 编写的一个图表库, 能够很简单便捷的在 Web 网站或是 Web 应用程序添加有交互性的图表,并且免费提供给个人学习、个人网站和非商业用途使用。
目录:
- highcharts 介绍
- highcharts 图表类型
- django + highcharts结合
- 质量平台 By Django + Highcharts + Mysql
内容:
一. highcharts 介绍
Highcharts 支持的图表类型有直线图、曲线图、区域图、柱状图、饼状图、散状点图、仪表图、气泡图、瀑布流图等多达 20 种图表,其中很多图表可以集成在同一个图形中形成混合图。
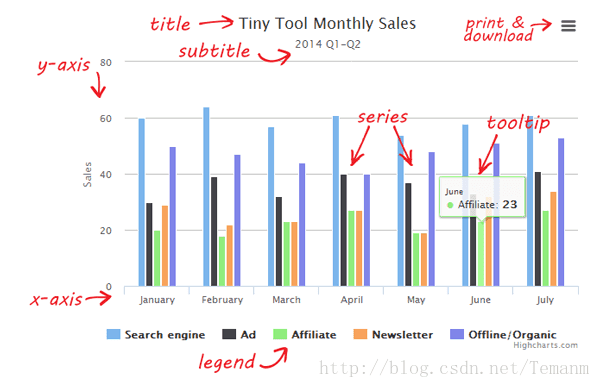
名词解释
- lang:语言文字对象,所有Highcharts文字相关的设置
- chart:图表区、图形区和通用图表配置选项
- colors:图表数据列颜色配置,是一个颜色数组
- credits: 版权信息,Highcharts在图表的右下方放置的版权信息及链
- drilldown:钻取,向下钻取数据,深入到其中的具体数据
- exporting:导出模块,导出功能配置,导出即将图表下载为图片或打印图表
- legend:图例,用不同形状、颜色、文字等 标示不同数据列,通过点击标示可以显示或隐藏该数据列
- loading:加载中,加载选项控制覆盖绘图区的加载屏的外观和文字
- navigation:导航,导出模块按钮和菜单配置选项组
- noData:没有数据,没有数据时显示的内容
- pane:分块,针对仪表图和雷达图专用的配置,主要设置弧度及背景色
- plotOptions:针对不同类型图表的配置
- series:数据列,图表上一个或多个数据系列,比如图表中的一条曲线,一个柱形
- title:标题,包括即标题和副标题,其中副标题为非必须的
- tooltip:数据点提示框,当鼠标滑过某点时,以框的形式提示改点的数据,比如该点的值,数据单位等
- Axis:坐标轴,包括x轴和y轴。多个不同的数据列可共用同一个X轴或Y轴,当然,还可以有两个X轴或Y轴,分别显示在图表的上下或左右
二.highcharts 图表类型
详情请查阅官方图表类型介绍文档:https://www.hcharts.cn/demo/highcharts
三.django + highcharts
django采取MVC框架,我们分4个Python文件,包括:models.py views.py url.py以及html模板文件
models.py文件主要和数据打交道,连接数据库,将数据提取交给view.py,也就是MVC中的M
views.py文件主要是将数据传给html,业务层,对web发过来的POST和GET请求进行处理,也就是MVC中的C
url.py文件主要是指定什么url展现那个html视图,相当于MVC中的V
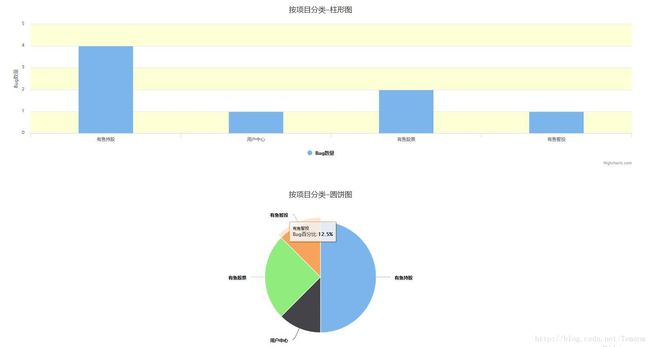
以柱形图和圆饼图为例:
- 官方柱形图文档JS+HTML:https://www.hcharts.cn/demo/highcharts/column-drilldown
- 官方圆饼图文档JS+HTML:https://www.hcharts.cn/demo/highcharts/pie-basic
按编码步骤进行讲解:
前置UtilScript.py:
# -*- coding:utf-8 -*-
import MySQLdb
# ----------------------------
# 错误码
# 正常返回 code : 200
# 数据连接失败 code : 400
# 请求参数有误 code : 401
# ----------------------------

# 连接MySQL db
def connect_db(db):
    try:
        conn = MySQLdb.connect(host="10.9.8.*",
                             port=3306,
                             user="monitor",
                             passwd="monitor1",
                             db=db,
                             charset="utf8")
    except Exception, e:
        conn = 400
    return conn


# 请求MySQL获取数据
def get_data(db, sql):
    conn = connect_db(db)
    if conn == 400:
        return conn
    else:
        try:
            cur = conn.cursor()
            cur.execute(sql)
            data = cur.fetchall()
            cur.close()
            conn.commit()
            conn.close()
            return data
        except Exception, e:
return 401- 第一步:编写models.py文件,将数据从mysql中取出
# -*- coding:utf-8 -*-
from UtilScript import ConnMySql
import sys
reload(sys)
sys.setdefaultencoding("utf-8")

# 按模块划分bug
def get_bugs_by_module():
    sql_modules = "select distinct bug_module from `bugs`"
    temp_modules = ConnMySql.get_data("schedule", sql_modules)
    modules = []
    for i in temp_modules:
        modules.append(i[0])
    modules_number = []
    for i in modules:
        sql_modules_number = "select count(*) from `bugs` where bug_module=\"%s\"" % str(i)
        modules_number.append(int(ConnMySql.get_data("schedule", sql_modules_number)[0][0]))
return modules, modules_number- 第二步:将models.py传过来的数据传给html模板进行渲染
# -----------------------------
# 缺陷统计
# -----------------------------
def bug_statistics(request):
    # bug by module
    temp_modules = BugStatistics.get_bugs_by_module()
    modules = temp_modules[0]
    modules_numbers = temp_modules[1]
    modules_pie = []
    for i in range(len(modules)):
        modules_pie.append([modules[i], modules_numbers[i]])

    # bug by reporter
    temp_reporter = BugStatistics.get_bug_by_reporter()
    reporter = temp_reporter[0]
    reporter_bug_number = temp_reporter[1]
    reporter_pie = []
    for i in range(len(reporter)):
        reporter_pie.append([reporter[i], reporter_bug_number[i]])

    # bug by result
    temp_result = BugStatistics.get_bug_by_result()
    result = temp_result[0]
    result_number = temp_result[1]
    result_pie = []
    for i in range(len(result)):
        result_pie.append([result[i], result_number[i]])

    return render_to_response("BugStatistics.html", {
        'modules': modules,
        'modules_numbers': modules_numbers,
        'modules_pie': modules_pie,
        'reporters': reporter,
        'reporter_bug_number': reporter_bug_number,
        'reporter_pie': reporter_pie,
        'results': result,
        'result_number': result_number,
        'result_pie': result_pie
})- 第三步:将views.py传给html的数据,在html利用{{ 参数 }}进行调用,展示出来
<script type="text/javascript">
        $(function () {
            $('#container_pic_module_column').highcharts({
                chart: {
                    type: 'column'
                },
                title: {
                    text: '按项目分类-柱形图'
                },
                xAxis: {
                    categories: [
                        {% for module in modules %}
                            "{{module}}",
                        {% endfor %}
                        ]
                     },
                yAxis: {
                    min: 0,
                    alternateGridColor: '#FDFFD5',
                    title: {
                        text: 'Bug数量'
                    }
                },
                plotOptions: {
                    column: {
                        pointPadding: 0.2,
                        borderWidth: 0
                    }
                },
                series: [{
                    name: 'Bug数量',
                    data: {{modules_numbers}}
                }]
            });
        });
    script>
    <script type="text/javascript">
        $(function () {
            $('#container_pic_module_pie').highcharts({
                chart: {
                    type: 'pie'
                },
                title: {
                    text: '按项目分类-圆饼图'
                },
                tooltip: {
                    pointFormat: '{series.name}:{point.percentage:.1f}%'
                },
                series: [{
                    type:'pie',
                    name: 'Bug百分比',
                    data:
                    [
                        {% for module in modules_pie %}
                            ["{{module.0}}",{{module.1}}],
                        {% endfor %}
                    ]
                 }]
            });
        });
    script>
四.质量平台
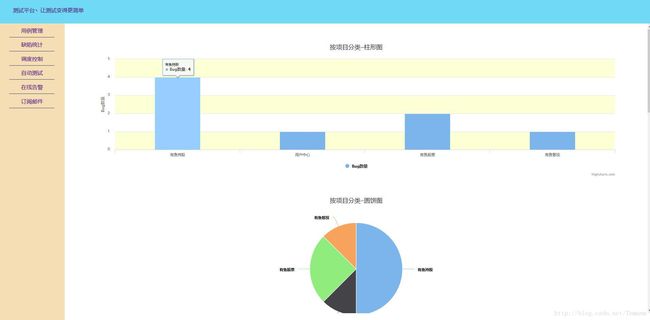
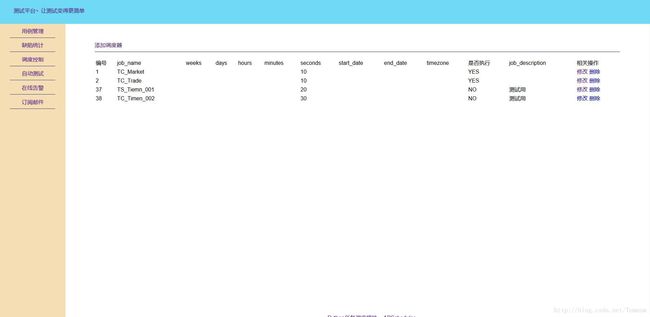
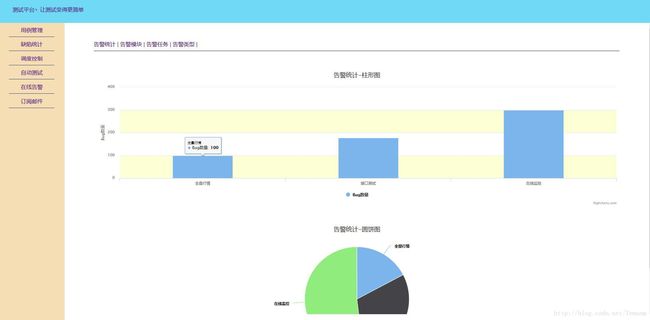
花了3天写了个质量平台的雏形,模仿公司现有的质量平台,很多功能都没实现,后续继续补上,公司先有的是另外一个自动化测试公司用Java写的,里面基本都是js调用以及Ajax,下图来看看这3天的成果
总结:
Python Django开发web实在是太快了,想对比现有公司Java写的个人感觉好很多,Python出名的web框架除了django还是flask和tornado,后续继续学习一下,分享出来。
参考文献:
Django 如何使用Highcharts,其实我们可以摈弃Django-chartit
