大数据学习笔记(二)-分级类聚&列类聚
下面用到的数据及代码:click here
1.获取数据:
来自100个博客里面的所有文章单词数目,这儿用的rss订阅源对文章数据进行获取,rss获取出来是xml文件格式,所以可以下载一个feedparser来对xml文档进行解析。关于怎么得到每篇博客的每个单词的统计情况,请自行查看generatefeedvector.py文件。不理解的地方欢迎交流。 获取后得到的文件为blogdata.txt。
2.分级类聚
分级类聚通过连续不断地将两个最相似的群组两两合并。树状图是分级类聚的一种可视化方法。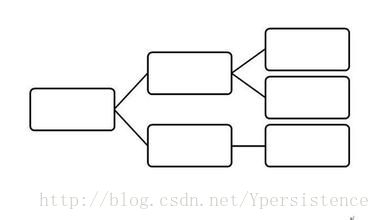
下面将介绍如何将以上我们生成的博客数据进行类聚。
①加载数据
#加载数据集,将博客标题存入rownames中,将单词数存在二位列表data中,将单词名放入colnames里
def readfile(filename):
    lines=[line for line in file(filename)]

    #第一行是列标题
    colnames=lines[0].strip().split('\t')[1:]
    rownames=[]
    data=[]
    for line in lines[1:]:
        p=line.strip().split('\t')
        #每行的第一列是行名
        rownames.append(p[0])
        #剩余部分就是该行对应的数据
        data.append([float(x) for x in p[1:]])
    return  rownames,colnames,data
②.这儿我们需要求两篇博客单词情况的相关度,之前博客里面学习了三种求相关度的方法,这儿因为一些博客比其他博客包含的文章条目更多,所以使用皮尔逊相关度,在这儿是对两个博客的相关度的数据集是一行的数据,所以我们需要对皮尔逊相关度算法进行小小的修改,
#v1,v2data中指的是不同两行数据
def pearson(v1,v2):
    sum1=sum(v1)
    sum2=sum(v2)

    sum1Sq=sum([pow(v,2) for v in v1])
    sum2Sq=sum([pow(v,2) for v in v2])

    pSum=sum([v1[i]*v2[i] for i in range(len(v1))])

    num=pSum-(sum1*sum2/len(v1))
    den=sqrt((sum1Sq-pow(sum1,2)/len(v1))*(sum2Sq-pow(sum2,2)/len(v1)))
    if den==0:
        return 0
    #因为皮尔逊相关度返回的是0-1的浮点数,而且越大表示这两个相关度越高,而我们这儿需要相关度越高距离越小,所以我们用1.0-num/den表示距离
    return 1.0-num/den
③.建立类聚点模型,
每个点都有一行数据集vec,以及该点是由拿两个点聚集而成left和right,这两个点的相似度距离distance,以及这个点的id。所以建立以下类
class bicluster:
    #vec表示该博客对应的点的向量,(就是data里面的一行数据),left和right表示该点是由哪两个点聚合而成的,distance是两点之间的距离,id是点的编号
    def __init__(self,vec,left=None,right=None,distance=0.0,id=None):
        self.left=left
        self.right=right
        self.vec=vec
        self.id=id
        self.distance=distance
④.递归合并聚类
这儿返回的是一个最后大聚类的点
细节自己理解,不理解的相互交流,
def hcluster(rows,distance=pearson):
    distances={}
    currentclustid=-1

    #最开始的聚类就是数据集中的行
    clust=[bicluster(rows[i],id=i) for i in range(len(rows))]

    while len(clust)>1:
        lowestpair=(0,1)
        closest=distance(clust[0].vec,clust[1].vec)

        #遍历每一个配对,寻找最小距离
        for i in range(len(clust)):
            for j in range(i+1,len(clust)):
                #用distances来缓存距离的计算值
                if (clust[i].id,clust[j].id) not in distances:
                    distances[(clust[i].id,clust[j].id)]=distance(clust[i].vec,clust[j].vec)
                d=distances[(clust[i].id,clust[j].id)]

                if d#计算两个聚类的平均值
        mergevec=[(clust[lowestpair[0]].vec[i]+clust[lowestpair[1]].vec[i])/2.0 for i in range(len(clust[0].vec))]

        #建立新的聚类
        newcluster=bicluster(mergevec,left=clust[lowestpair[0]],right=clust[lowestpair[1]],distance=closest,id=currentclustid)

        #不在原始集合中的聚类,其id为负数
        currentclustid-=1
        del clust[lowestpair[1]]
        del clust[lowestpair[0]]
        clust.append(newcluster)
    return clust[0]
⑤.图形版的类聚树
#打印类似文件系统层次结构的递归遍历类聚树
def printclust(clust,lables=None,n=0):
    #利用缩进来建立层级布局
    for i in range(n):
        print ' ',
    if clust.id<0:
        #负数代表分支
        print '-'
    else:
        #正数代表叶节点
        if lables==None:
            print clust.id
        else:
            print lables[clust.id]
    #现在开始打印右侧分支和左侧分支
    if clust.left!=None:
        printclust(clust.left,lables=lables,n=n+1)
    if clust.right!=None:
        printclust(clust.right,lables=lables,n=n+1)
⑥.绘制树状图来更直观的查看类聚树
这儿需要用到python的PIL模块,先去在上面百度网盘中下载Pillow-3.4.2-cp27-cp27m-win_amd64.whl文件,然后进入该存放文件的目录下打开cmd,执行
pip install Pillow-3.4.2-cp27-cp27m-win_amd64.whl绘制代码如下
#得到聚类的高度
def gethight(clust):
    #叶节点的高度为1
    if clust.left==None and clust.right==None:
        return 1
    else:
        return gethight(clust.left)+gethight(clust.right)
def getdepth(clust):
    #叶节点的距离为0.0
    if clust.left==None and clust.right==None:
        return 0
    #直接点的距离等于左右两侧距离的较大者+该节点自身的距离
    else:
        return max(getdepth(clust.left),getdepth(clust.right))+clust.distance

#生成一个图片
def drawdendrogram(clust,lables,jpeg='clusters.jpg'):
    #高度和宽度
    h=gethight(clust)*20
    w=1200
    depth=getdepth(clust)

    #由于宽度是固定的,对距离值做调整
    scaling=float(w-150)/depth

    #新建一个白色背景图片
    img=Image.new('RGB',(w,h),(255,255,255))
    draw=ImageDraw.Draw(img)

    draw.line((0,h/2,10,h/2),fill=(255,0,0))

    #画第一个节点
    drawnode(draw,clust,10,(h/2),scaling,lables)
    img.save(jpeg,'JPEG')

#对于每一个点进行作图
def drawnode(draw,clust,x,y,scaling,lables):
    if clust.id<0:
        h1=gethight(clust.left)*20
        h2=gethight(clust.right)*20
        top=y-(h1+h2)/2
        bottom=y+(h1+h2)/2

        #线的长度
        ll=clust.distance*scaling

        #聚类到其子节点的垂直线
        draw.line((x,top+h1/2,x,bottom-h2/2),fill=(255,0,0))

        #链接左侧节点的水平线
        draw.line((x, top + h1 / 2, x+ll, top+ h1 / 2), fill=(255, 0, 0))

        # 链接右侧节点的水平线
        draw.line((x, bottom-h2 / 2, x + ll, bottom - h2 / 2), fill=(255, 0, 0))

        #递归绘制左右节点
        drawnode(draw,clust.left,x+ll,top+h1/2,scaling,lables)
        drawnode(draw,clust.right,x+ll,bottom-h2/2,scaling,lables)
    else:
        #绘制叶节点标签
        draw.text((x+5,y-7),lables[clust.id],(0,0,0))
2.列类聚
前面博客也提到了转化人和物品进行推荐,当然我们这儿也可以转化行列,求单词的类聚,转化行列代码如下
#转化数据集的行和列
def rotatetmatrix(data):
    newdata=[]
    for i in range(len(data[0])):
        newrow = [data[j][i] for j in range (len(data))]
        newdata.append(newrow)
    return newdata
最后执行main函数里面的语句即可。
通过执行cluster.py,我们可以得到两张图片,分别是针对于博客和单词的类聚,我们可以看出同一类聚的相似性,就可以对这些进行分析了。