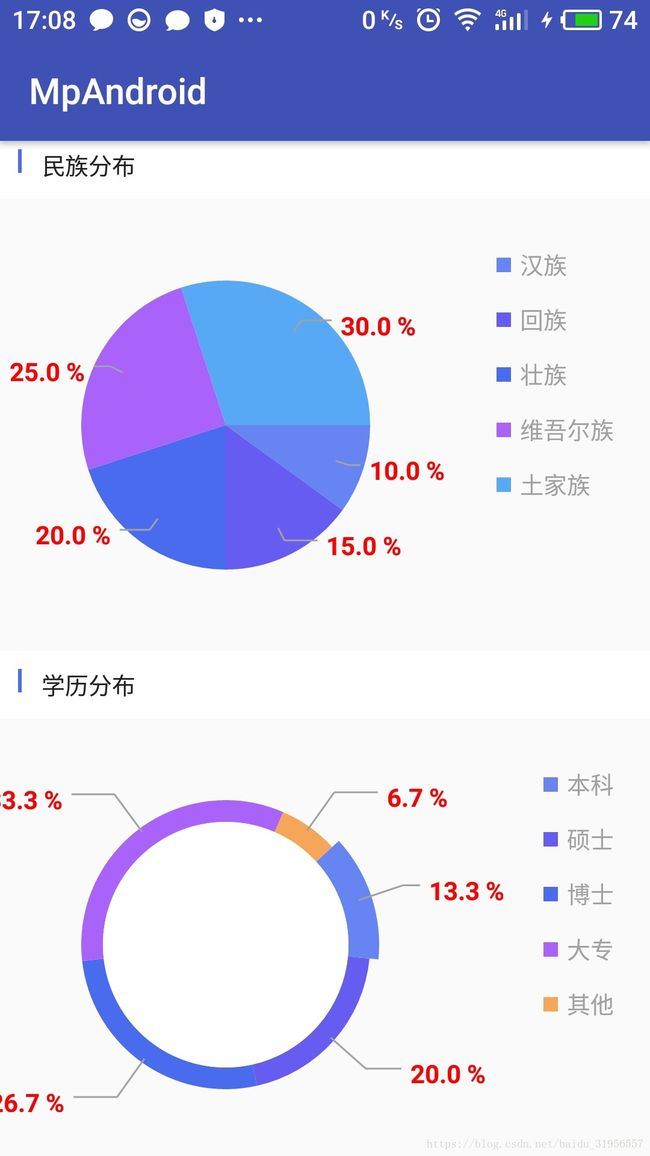
MPAndroidChart饼图和圆环详细使用(一)
利用第三方框架MPAndroidChart,制作圆形和圆环图标
1.添加依赖,建议下载lib包,进行依赖
https://github.com/PhilJay/MPAndroidChart2.填写布局文件
<ScrollView
    xmlns:android="http://schemas.android.com/apk/res/android"
    android:layout_width="match_parent"
    android:layout_height="match_parent"
    >
<LinearLayout

    android:layout_width="match_parent"
    android:layout_height="match_parent"
    android:orientation="vertical"
    >
    <LinearLayout
        android:layout_width="match_parent"
        android:layout_height="wrap_content"
        android:orientation="vertical">

        <LinearLayout
            android:layout_width="match_parent"
            android:layout_height="wrap_content"
            android:background="#ffffff"
            android:orientation="horizontal"
            android:paddingLeft="10dp">

            <TextView
                android:layout_width="2dp"
                android:layout_height="13dp"
                android:background="#4a6def"
                android:paddingLeft="10dp" />

            <TextView
                android:layout_width="wrap_content"
                android:layout_height="wrap_content"
                android:layout_marginLeft="11dp"
                android:paddingBottom="10dp"
                android:paddingTop="10dp"
                android:text="民族分布"
                android:textColor="#222222"
                android:textSize="14sp" />
        LinearLayout>

        <com.github.mikephil.charting.charts.PieChart
            android:id="@+id/pie_chat1"
            android:layout_width="match_parent"
            android:layout_height="250dp"
             />
    LinearLayout>

    <LinearLayout
        android:layout_width="match_parent"
        android:layout_height="wrap_content"
        android:orientation="vertical">

        <LinearLayout
            android:layout_width="match_parent"
            android:layout_height="wrap_content"
            android:background="#ffffff"
            android:orientation="horizontal"
            android:paddingLeft="10dp">

            <TextView
                android:layout_width="2dp"
                android:layout_height="13dp"
                android:background="#4a6def"
                android:paddingLeft="10dp" />

            <TextView
                android:layout_width="wrap_content"
                android:layout_height="wrap_content"
                android:layout_marginLeft="11dp"
                android:paddingBottom="10dp"
                android:paddingTop="10dp"
                android:text="学历分布"
                android:textColor="#222222"
                android:textSize="14sp" />
        LinearLayout>

        <com.github.mikephil.charting.charts.PieChart
            android:id="@+id/pie_chat2"
            android:layout_width="match_parent"
            android:layout_height="250dp"
            />
    LinearLayout>
LinearLayout>
ScrollView>
3. 初始化控件,并设置数据
package com.phone.mpandroid;

import android.graphics.Color;
import android.os.Bundle;
import android.support.v7.app.AppCompatActivity;

import com.github.mikephil.charting.charts.PieChart;
import com.github.mikephil.charting.data.PieEntry;

import java.util.ArrayList;
import java.util.List;

public class HodleCricle extends AppCompatActivity {

    private PieChart pieChart,pie_chat2;

    @Override
    protected void onCreate(Bundle savedInstanceState) {
        super.onCreate(savedInstanceState);
        setContentView(R.layout.activity_hodle_cricle);

        initView();
    }

    private void initView() {
        pieChart = (PieChart) findViewById(R.id.pie_chat1);
        pie_chat2= (PieChart) findViewById(R.id.pie_chat2);
        showhodlePieChart();

        showRingPieChart();
    }

    private void showRingPieChart() {
//设置每份所占数量
        List yvals = new ArrayList<>();
        yvals.add(new PieEntry(2.0f, "本科"));
        yvals.add(new PieEntry(3.0f, "硕士"));
        yvals.add(new PieEntry(4.0f, "博士"));
        yvals.add(new PieEntry(5.0f, "大专"));
        yvals.add(new PieEntry(1.0f, "其他"));
// 设置每份的颜色
        List colors = new ArrayList<>();
        colors.add(Color.parseColor("#6785f2"));
        colors.add(Color.parseColor("#675cf2"));
        colors.add(Color.parseColor("#496cef"));
        colors.add(Color.parseColor("#aa63fa"));
        colors.add(Color.parseColor("#f5a658"));
        PieChartManagger pieChartManagger=new PieChartManagger(pie_chat2);
        pieChartManagger.showRingPieChart(yvals,colors);
    }

    private void showhodlePieChart() {
        // 设置每份所占数量
        List yvals = new ArrayList<>();
        yvals.add(new PieEntry(2.0f, "汉族"));
        yvals.add(new PieEntry(3.0f, "回族"));
        yvals.add(new PieEntry(4.0f, "壮族"));
        yvals.add(new PieEntry(5.0f, "维吾尔族"));
        yvals.add(new PieEntry(6.0f, "土家族"));
        //设置每份的颜色
        List colors = new ArrayList<>();
        colors.add(Color.parseColor("#6785f2"));
        colors.add(Color.parseColor("#675cf2"));
        colors.add(Color.parseColor("#496cef"));
        colors.add(Color.parseColor("#aa63fa"));
        colors.add(Color.parseColor("#58a9f5"));

        PieChartManagger pieChartManagger=new PieChartManagger(pieChart);
        pieChartManagger.showSolidPieChart(yvals,colors);
    }
}
4.编写显示圆形圆环的的管理类
package com.phone.mpandroid;

import android.graphics.Color;
import android.graphics.Typeface;

import com.github.mikephil.charting.charts.PieChart;
import com.github.mikephil.charting.components.Legend;
import com.github.mikephil.charting.data.PieData;
import com.github.mikephil.charting.data.PieDataSet;
import com.github.mikephil.charting.data.PieEntry;
import com.github.mikephil.charting.formatter.PercentFormatter;

import java.util.List;

/**
 * Created by zhang on 2018/7/5.
 */

public class PieChartManagger {

    public PieChart pieChart;

    public PieChartManagger(PieChart pieChart) {
        this.pieChart = pieChart;
        initPieChart();
    }

    //初始化
    private void initPieChart() {
        //  是否显示中间的洞
        pieChart.setDrawHoleEnabled(false);
        pieChart.setHoleRadius(40f);//设置中间洞的大小
        // 半透明圈
        pieChart.setTransparentCircleRadius(30f);
        pieChart.setTransparentCircleColor(Color.WHITE); //设置半透明圆圈的颜色
        pieChart.setTransparentCircleAlpha(125); //设置半透明圆圈的透明度

        //饼状图中间可以添加文字
        pieChart.setDrawCenterText(false);
        pieChart.setCenterText("民族"); //设置中间文字
        pieChart.setCenterTextColor(Color.parseColor("#a1a1a1")); //中间问题的颜色
        pieChart.setCenterTextSizePixels(36);  //中间文字的大小px
        pieChart.setCenterTextRadiusPercent(1f);
        pieChart.setCenterTextTypeface(Typeface.DEFAULT); //中间文字的样式
        pieChart.setCenterTextOffset(0, 0); //中间文字的偏移量


        pieChart.setRotationAngle(0);// 初始旋转角度
        pieChart.setRotationEnabled(true);// 可以手动旋转
        pieChart.setUsePercentValues(true);//显示成百分比
        pieChart.getDescription().setEnabled(false); //取消右下角描述

        //是否显示每个部分的文字描述
        pieChart.setDrawEntryLabels(false);
        pieChart.setEntryLabelColor(Color.RED); //描述文字的颜色
        pieChart.setEntryLabelTextSize(14);//描述文字的大小
        pieChart.setEntryLabelTypeface(Typeface.DEFAULT_BOLD); //描述文字的样式

        //图相对于上下左右的偏移
        pieChart.setExtraOffsets(20, 8, 75, 8);
        //图标的背景色
        pieChart.setBackgroundColor(Color.TRANSPARENT);
//        设置pieChart图表转动阻力摩擦系数[0,1]
        pieChart.setDragDecelerationFrictionCoef(0.75f);

        //获取图例
        Legend legend = pieChart.getLegend();
        legend.setOrientation(Legend.LegendOrientation.VERTICAL);  //设置图例水平显示
        legend.setVerticalAlignment(Legend.LegendVerticalAlignment.TOP); //顶部
        legend.setHorizontalAlignment(Legend.LegendHorizontalAlignment.RIGHT); //右对其

        legend.setXEntrySpace(7f);//x轴的间距
        legend.setYEntrySpace(10f); //y轴的间距
        legend.setYOffset(10f);  //图例的y偏移量
        legend.setXOffset(10f);  //图例x的偏移量
        legend.setTextColor(Color.parseColor("#a1a1a1")); //图例文字的颜色
        legend.setTextSize(13);  //图例文字的大小

    }


    /**
     * 显示实心圆
     * @param yvals
     * @param colors
     */
    public void showSolidPieChart(List yvals, List colors) {
        //数据集合
        PieDataSet dataset = new PieDataSet(yvals, "");
        //填充每个区域的颜色
        dataset.setColors(colors);
        //是否在图上显示数值
        dataset.setDrawValues(true);
//        文字的大小
        dataset.setValueTextSize(14);
//        文字的颜色
        dataset.setValueTextColor(Color.RED);
//        文字的样式
        dataset.setValueTypeface(Typeface.DEFAULT_BOLD);

//      当值位置为外边线时,表示线的前半段长度。
        dataset.setValueLinePart1Length(0.4f);
//      当值位置为外边线时,表示线的后半段长度。
        dataset.setValueLinePart2Length(0.4f);
//      当ValuePosits为OutsiDice时,指示偏移为切片大小的百分比
        dataset.setValueLinePart1OffsetPercentage(80f);
        // 当值位置为外边线时,表示线的颜色。
        dataset.setValueLineColor(Color.parseColor("#a1a1a1"));
//        设置Y值的位置是在圆内还是圆外
        dataset.setYValuePosition(PieDataSet.ValuePosition.OUTSIDE_SLICE);
//        设置Y轴描述线和填充区域的颜色一致
        dataset.setUsingSliceColorAsValueLineColor(false);
//        设置每条之前的间隙
        dataset.setSliceSpace(0);

        //设置饼状Item被选中时变化的距离
        dataset.setSelectionShift(5f);
        //填充数据
        PieData pieData = new PieData(dataset);
//        格式化显示的数据为%百分比
        pieData.setValueFormatter(new PercentFormatter());
//        显示试图
        pieChart.setData(pieData);
    }


    /**
     * 显示圆环
     * @param yvals
     * @param colors
     */
    public void  showRingPieChart(List yvals, List colors){
        //显示为圆环
        pieChart.setDrawHoleEnabled(true);
        pieChart.setHoleRadius(85f);//设置中间洞的大小

        //数据集合
        PieDataSet dataset = new PieDataSet(yvals, "");
        //填充每个区域的颜色
        dataset.setColors(colors);
        //是否在图上显示数值
        dataset.setDrawValues(true);
//        文字的大小
        dataset.setValueTextSize(14);
//        文字的颜色
        dataset.setValueTextColor(Color.RED);
//        文字的样式
        dataset.setValueTypeface(Typeface.DEFAULT_BOLD);

//      当值位置为外边线时,表示线的前半段长度。
        dataset.setValueLinePart1Length(0.4f);
//      当值位置为外边线时,表示线的后半段长度。
        dataset.setValueLinePart2Length(0.4f);
//      当ValuePosits为OutsiDice时,指示偏移为切片大小的百分比
        dataset.setValueLinePart1OffsetPercentage(80f);
        // 当值位置为外边线时,表示线的颜色。
        dataset.setValueLineColor(Color.parseColor("#a1a1a1"));
//        设置Y值的位置是在圆内还是圆外
        dataset.setYValuePosition(PieDataSet.ValuePosition.OUTSIDE_SLICE);
//        设置Y轴描述线和填充区域的颜色一致
        dataset.setUsingSliceColorAsValueLineColor(false);
//        设置每条之前的间隙
        dataset.setSliceSpace(0);

        //设置饼状Item被选中时变化的距离
        dataset.setSelectionShift(5f);
        //填充数据
        PieData pieData = new PieData(dataset);
//        格式化显示的数据为%百分比
        pieData.setValueFormatter(new PercentFormatter());
//        显示试图
        pieChart.setData(pieData);

    }


} 