CART决策树的sklearn实现及其GraphViz可视化
这一部分,我使用了sklearn来调用决策树模型对葡萄酒数据进行分类。在此之外,使用Python调用AT&T实验室开源的画图工具GraphViz软件以实现决策树的可视化。
from sklearn.datasets import load_iris
from sklearn import tree
from sklearn.externals.six import StringIO
import pydot
dot_data = StringIO()
iris = load_iris()
clf = tree.DecisionTreeClassifier()
clf = clf.fit(iris.data, iris.target)
tree.export_graphviz(clf, out_file=dot_data)
graph = pydot.graph_from_dot_data(dot_data.getvalue())
graph.write_pdf("iris.pdf")
这是一段基本的利用pydot+GraphViz实现决策树可视化的代码。由于缺少pydot库,直接无法执行,我们在命令行中pip install pydot后再执行,发现报错:
AttributeError: ‘list’ object has no attribute ‘write_pdf’
在StackOverflow中搜索此问题,发现我们要将pydot改为pydotplus,好吧,现在连库都升plus了,继续pip install pydotplus,执行,发现继续报错:
InvocationException:GraphViz’s executables not found
这意味着我们还缺一个GraphViz软件,关于其安装,我整理了一份靠谱攻略:GraphViz配置指南。配置完成后,重启IDE,得以顺利执行代码。下面,我写了一段利用sklearn对葡萄酒数据集进行分类、利用pydotplus+GraphViz进行决策树可视化的代码,可供测试,数据见葡萄酒数据集。
Python源码
# !/usr/bin/env python3
# coding=utf-8
"""
Decision Tree on the Basis of sklearn module
Author  :Chai Zheng
Blog    :http://blog.csdn.net/chai_zheng/
Github  :https://github.com/Chai-Zheng/Machine-Learning
Email   :[email protected]
Date    :2017.10.13
"""

import os
import time
import pydotplus
import numpy as np
from sklearn import tree
from sklearn.externals.six import StringIO
from sklearn.model_selection import train_test_split

print('Step 1.Loading data...')
data = np.loadtxt("Wine.txt",delimiter=',')
x = data[:,1:14]
y = data[:,0].reshape(178,1)
X_train,X_test,Y_train,Y_test = train_test_split(x,y,test_size=0.4)
print('---Loading and splitting completed.')

print('Step 2.Training...')
startTime = time.time()
clf = tree.DecisionTreeClassifier()
clf = clf.fit(X_train,Y_train)
print('---Training Completed.Took %f s.'%(time.time()-startTime))

print('Step 3.Testing...')
Y_predict = clf.predict(X_test)
matchCount = 0
for i in range(len(Y_predict)):
    if Y_predict[i] == Y_test[i]:
        matchCount += 1
accuracy = float(matchCount/len(Y_predict))
print('---Testing completed.Accuracy: %.3f%%'%(accuracy*100))

feature_name = ['Alcohol','Malic Acid','Ash','Alcalinity of Ash','Magnesium','Total Phenols',
                'Flavanoids','Nonflavanoid Phenols','Proantocyanins','Color Intensity','Hue',
                'OD280/OD315 of Diluted Wines','Proline']
target_name = ['Class1','Class2','Class3']

dot_data = StringIO()
tree.export_graphviz(clf,out_file = dot_data,feature_names=feature_name,
                     class_names=target_name,filled=True,rounded=True,
                     special_characters=True)
graph = pydotplus.graph_from_dot_data(dot_data.getvalue())
graph.write_pdf("WineTree.pdf")
print('Visible tree plot saved as pdf.')
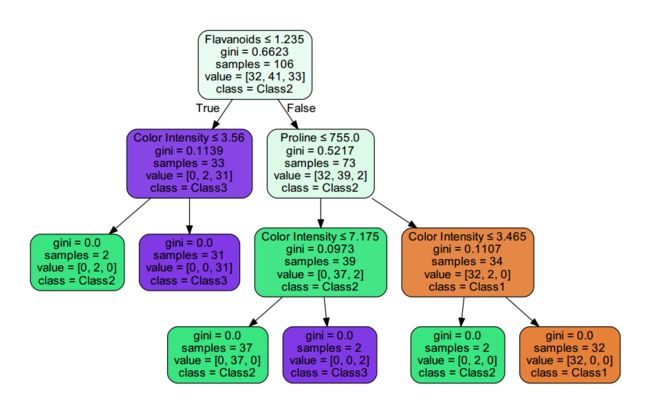
自动生成的可视化决策树被保存在当前目录下的“WineTree.pdf”文件中,如下所示:
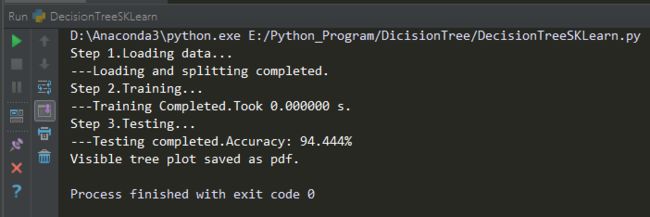
是不是第一次看到这么清晰明了的分类模型?可以看到,我们使用GINI指数来选择最优划分属性,并且经剪枝后的决策树只用到了数据13个属性中的Flavanoids、Color Insenty、Proline这三个属性,可以说是非常简洁了。在测试集中进行测试,结果如下:
由于数据拆分的随机性,测试准确率大概在85%-95%之间,不算太高。但胜在模型直观、可解释性强,并且运算速度非常快。

