运行环境:win10 64位 py 3.6 pycharm 2018.1.1
from sklearn import datasets,cross_validation,naive_bayes
import numpy as np
import matplotlib.pyplot as plt
def show_digits():
digits = datasets.load_digits()
fig = plt.figure()
print('vector from images 0:',digits.data[0])
for i in range(25):
ax = fig.add_subplot(5,5,i+1)
ax.imshow(digits.images[i],cmap=plt.cm.gray_r,interpolation='nearest')
plt.show()
show_digits()
def load_data():
digits = datasets.load_digits()
return cross_validation.train_test_split(digits.data,digits.target,test_size=0.25,random_state=0)
def test_GaussianNB(*data):
X_train, X_test, y_train, y_test = data
cls = naive_bayes.GaussianNB()
cls.fit(X_train,y_train)
print('Traing score : %.2f' % cls.score(X_train,y_train))
print('Testing score : %.2f' % cls.score(X_test,y_test))
X_train, X_test, y_train, y_test = load_data()
test_GaussianNB(X_train, X_test, y_train, y_test)
def test_MultinomialNB(*data):
X_train, X_test, y_train, y_test = data
cls = naive_bayes.MultinomialNB()
cls.fit(X_train,y_train)
print("Training score:%.2f"%cls.score(X_train,y_train))
print("Testing score:%.2f"%cls.score(X_test,y_test))
X_train, X_test, y_train, y_test = load_data()
test_MultinomialNB(X_train, X_test, y_train, y_test)
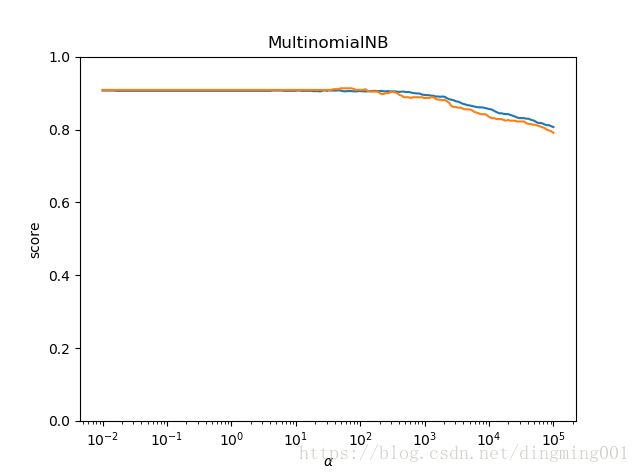
def test_MultinomialNB_alpha(*data):
X_train, X_test, y_train, y_test = data
alphas = np.logspace(-2,5,num=200)
train_scores = []
test_scores = []
for alpha in alphas:
cls = naive_bayes.MultinomialNB(alpha=alpha)
cls.fit(X_train,y_train)
train_scores.append(cls.score(X_train,y_train))
test_scores.append(cls.score(X_test,y_test))
fig = plt.figure()
ax = fig.add_subplot(1,1,1)
ax.plot(alphas,train_scores,label='Training Score')
ax.plot(alphas,test_scores,label='Testing Score')
ax.set_xlabel(r'$\alpha$')
ax.set_ylabel('score')
ax.set_ylim(0,1.0)
ax.set_title('MultinomialNB')
ax.set_xscale('log')
plt.show()
X_train, X_test, y_train, y_test = load_data()
test_MultinomialNB_alpha(X_train, X_test, y_train, y_test)

def test_BernoulliNB(*data):
X_train, X_test, y_train, y_test = data
cls = naive_bayes.BernoulliNB()
cls.fit(X_train,y_train)
print("Training score:%.2f" % cls.score(X_train, y_train))
print("Testing score:%.2f"%cls.score(X_test,y_test))
X_train, X_test, y_train, y_test = load_data()
test_BernoulliNB(X_train, X_test, y_train, y_test)
def test_BernoulliNB_alpha(*data):
X_train, X_test, y_train, y_test = data
alphas = np.logspace(-2,5,num=200)
train_scores = []
test_scores = []
for alpha in alphas:
cls = naive_bayes.BernoulliNB(alpha=alpha)
cls.fit(X_train,y_train)
train_scores.append(cls.score(X_train,y_train))
test_scores.append(cls.score(X_test,y_test))
fig = plt.figure()
ax = fig.add_subplot(1,1,1)
ax.plot(alphas,train_scores,label='Training Score')
ax.plot(alphas,test_scores,label='Testing Score')
ax.set_xlabel(r'$\alpha$')
ax.set_ylabel('score')
ax.set_ylim(0,1.0)
ax.set_title('BernoulliNB')
ax.set_xscale('log')
ax.legend(loc='best')
plt.show()
X_train, X_test, y_train, y_test = load_data()
test_BernoulliNB_alpha(X_train, X_test, y_train, y_test)

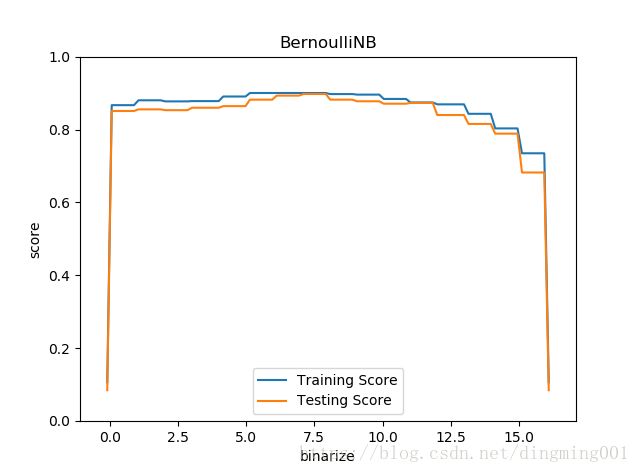
def test_BernoulliNB_binarize(*data):
X_train, X_test, y_train, y_test = data
min_x = min(np.min(X_train.ravel()),np.min(X_test.ravel())) - 0.1
max_x = max(np.max(X_train.ravel()),np.max(X_test.ravel())) + 0.1
binarizes = np.linspace(min_x,max_x,endpoint=True,num=100)
train_scores = []
test_scores = []
for binarize in binarizes:
cls = naive_bayes.BernoulliNB(binarize=binarize)
cls.fit(X_train,y_train)
train_scores.append(cls.score(X_train,y_train))
test_scores.append(cls.score(X_test,y_test))
fig = plt.figure()
ax = fig.add_subplot(1,1,1)
ax.plot(binarizes,train_scores,label='Training Score')
ax.plot(binarizes,test_scores,label='Testing Score')
ax.set_xlabel('binarize')
ax.set_ylabel('score')
ax.set_ylim(0,1.0)
ax.set_xlim(min_x-1,max_x+1)
ax.set_title('BernoulliNB')
ax.legend(loc='best')
plt.show()
X_train, X_test, y_train, y_test = load_data()
test_BernoulliNB_binarize(X_train, X_test, y_train, y_test)


