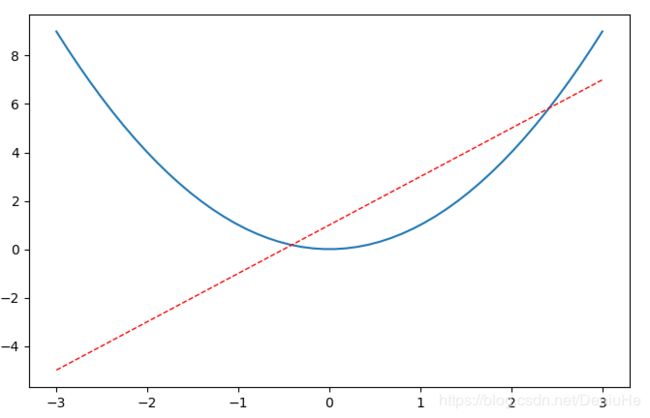
1、在一张图上画多条曲线
import matplotlib.pyplot as plt
import numpy as np

x = np.linspace(-3,3,50)  #设置横轴的取值点

y1 = 2 * x + 1
#曲线1
y2 = x**2
#曲线2
plt.figure(num=3,figsize=(8,5))
plt.plot(x,y2)
plt.plot(x,y1,color='red',linewidth=1,linestyle='--')

plt.show()

2、设置坐标轴的长度
plt.figure(num=3,figsize=(8,5))
3、设置坐标轴的取值范围
import matplotlib.pyplot as plt
import numpy as np

x = np.linspace(-3,3,50)

y1 = 2 * x + 1
y2 = x**2

# plt.figure(num=1)
# plt.plot(x,y1)

plt.figure(num=3,figsize=(8,5))
plt.plot(x,y2)
plt.plot(x,y1,color='red',linewidth=1,linestyle='--')
plt.xlim((-1,2))
plt.ylim((-1,2))
4、设置坐标轴的名称
import matplotlib.pyplot as plt
import numpy as np

x = np.linspace(-3,3,50)

y1 = 2 * x + 1
y2 = x**2

# plt.figure(num=1)
# plt.plot(x,y1)

plt.figure(num=3,figsize=(8,5))
plt.plot(x,y2)
plt.plot(x,y1,color='red',linewidth=1,linestyle='--')
plt.xlim((-1,2))
plt.ylim((-1,2))
plt.xlabel('XXX')
plt.ylabel('YYY')

plt.show()
5、重新设置坐标轴上的刻度
import matplotlib.pyplot as plt
import numpy as np

x = np.linspace(-3,3,50)

y1 = 2 * x + 1
y2 = x**2

# plt.figure(num=1)
# plt.plot(x,y1)

plt.figure(num=3,figsize=(8,5))
plt.plot(x,y2)
plt.plot(x,y1,color='red',linewidth=1,linestyle='--')
plt.xlim((-1,2))
plt.ylim((-1,2))
plt.xlabel('XXX')
plt.ylabel('YYY')
#
new_ticks = np.linspace(-1,2,10)
print(new_ticks)
plt.xticks(new_ticks)
plt.yticks([-2,-1.8,-1,1.22,3],['really bad','bad','normal','good','really good'])


plt.show()
