开源GraphView的使用--数据统计
最近做室内定位需要绘出加速度传感器输出的三个方向的加速度曲线,找到了开源https://github.com/jjoe64/GraphView-Demos,省去了要重新学MatLab *=*。
在http://www.android-graphview.org/download--getting-started.html下载.jar包。
1、GraphView的使用和普通View的使用相同。在Layout中:
		GraphView graph = (GraphView) findViewById(R.id.graph);
		LineGraphSeries series = new LineGraphSeries(new DataPoint[] {
				 new DataPoint(0, 1),
	    			new DataPoint(1, 5),
	    			new DataPoint(2, 3),
	    			new DataPoint(3, 2),
	    			new DataPoint(4, 6)
		});
graph.addSeries(series); 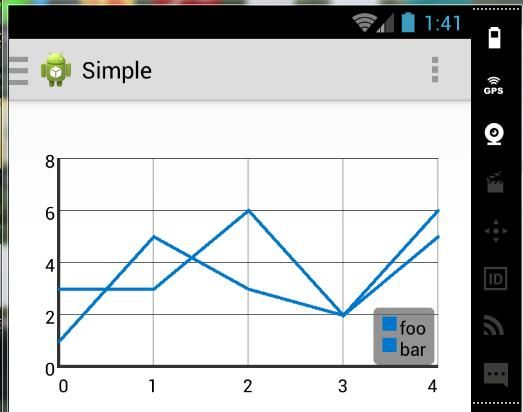
 GraphView graph = (GraphView) rootView.findViewById(R.id.graph);
        BarGraphSeries series = new BarGraphSeries(new DataPoint[] {
                new DataPoint(0, -2),
                new DataPoint(1, 5),
                new DataPoint(2, 3),
                new DataPoint(3, 2),
                new DataPoint(4, 6)
        });
        series.setSpacing(30);
graph.addSeries(series); 
	PointsGraphSeries series3 = new PointsGraphSeries(new DataPoint[] {
			    new DataPoint(0, 0),
			    new DataPoint(1, 3),
			    new DataPoint(2, 1),
			    new DataPoint(3, 0),
			    new DataPoint(4, 4)
			});
			graph.addSeries(series3);
			series3.setShape(PointsGraphSeries.Shape.TRIANGLE);//设置点的形状
series3.setColor(Color.YELLOW); 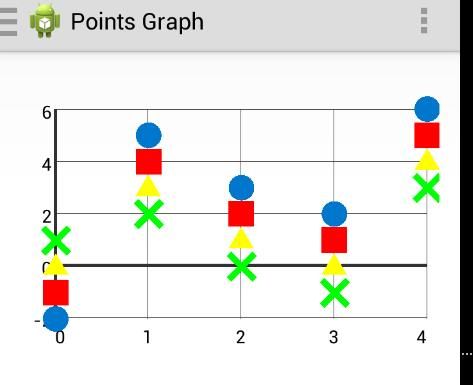
也可以在XML中使用,但通过.jar包的不支持此功能。
3、设置各种属性
设置每条曲线的标注:
		graph.getLegendRenderer().setVisible(true);
		graph.getLegendRenderer().setAlign(LegendRenderer.LegendAlign.TOP);//右上角对每条线注释
		graph.getLegendRenderer().setTextColor(Color.WHITE);//标注字的颜色
		series.setTitle("foo");
		series1.setTitle("bar");
设置轴的数据显示格式:
	//设置轴分割数字格式
		NumberFormat nf = NumberFormat.getInstance();
		nf.setMinimumFractionDigits(1);//小数位数
		nf.setMinimumIntegerDigits(2);//整数部分位数
		graph.getGridLabelRenderer().setLabelFormatter(new DefaultLabelFormatter(nf, nf));
自定义画笔:
	//自定义画笔
		Paint paint = new Paint();
		paint.setStyle(Paint.Style.STROKE);
		paint.setStrokeWidth(10);
		paint.setPathEffect(new DashPathEffect(new float[]{8, 5}, 0));
		series1.setCustomPaint(paint);
点击事件:
	//线条点击事件
		series.setOnDataPointTapListener(new OnDataPointTapListener() {
		    @Override
		    public void onTap(Series series, DataPointInterface dataPoint) {
		        Toast.makeText(MainActivity.this, "Series1: On Data Point clicked: "+dataPoint, Toast.LENGTH_SHORT).show();
		    }
		});
设置表格(分割线)颜色:
graph.getGridLabelRenderer().setGridColor(Color.WHITE);//表格颜色实例展示:
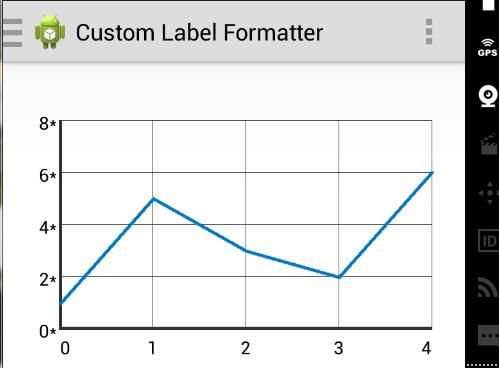
自定义轴标签:
graph.getGridLabelRenderer().setLabelFormatter(new DefaultLabelFormatter() {
            @Override
            public String formatLabel(double value, boolean isValueX) {
                if (isValueX) {
                    // show normal x values
                    return super.formatLabel(value, isValueX);
                } else {
                    // show currency for y values
                    return super.formatLabel(value, isValueX) + "*";
                }
            }
        });
X轴设置为时间:
        // generate Dates
        Calendar calendar = Calendar.getInstance();
        Date d1 = calendar.getTime();
        calendar.add(Calendar.DATE, 1);
        Date d2 = calendar.getTime();
        calendar.add(Calendar.DATE, 1);
        Date d3 = calendar.getTime();

        GraphView graph = (GraphView) rootView.findViewById(R.id.graph);

        // you can directly pass Date objects to DataPoint-Constructor
        // this will convert the Date to double via Date#getTime()
        LineGraphSeries series = new LineGraphSeries(new DataPoint[] {
                new DataPoint(d1, 1),
                new DataPoint(d2, 5),
                new DataPoint(d3, 3)
        });
        graph.addSeries(series);

        // set date label formatter
        graph.getGridLabelRenderer().setLabelFormatter(new DateAsXAxisLabelFormatter(getActivity()));
        graph.getGridLabelRenderer().setNumHorizontalLabels(3); // only 4 because of the space

        // set manual x bounds to have nice steps
        graph.getViewport().setMinX(d1.getTime());
        graph.getViewport().setMaxX(d3.getTime());
        graph.getViewport().setXAxisBoundsManual(true);

        // as we use dates as labels, the human rounding to nice readable numbers
        // is not nessecary
graph.getGridLabelRenderer().setHumanRounding(false); 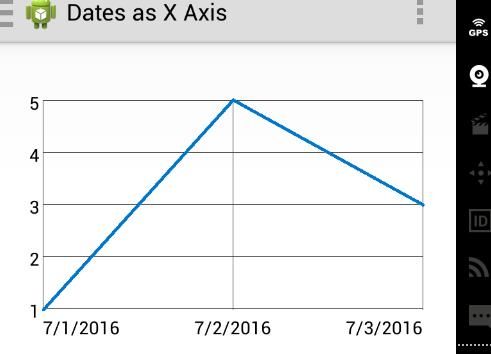
设置X、Y轴 Bounds:
 // set manual X bounds
        graph.getViewport().setXAxisBoundsManual(true);
        graph.getViewport().setMinX(0.5);
        graph.getViewport().setMaxX(3.5);

        // set manual Y bounds
        graph.getViewport().setYAxisBoundsManual(true);
        graph.getViewport().setMinY(3.5);
        graph.getViewport().setMaxY(8);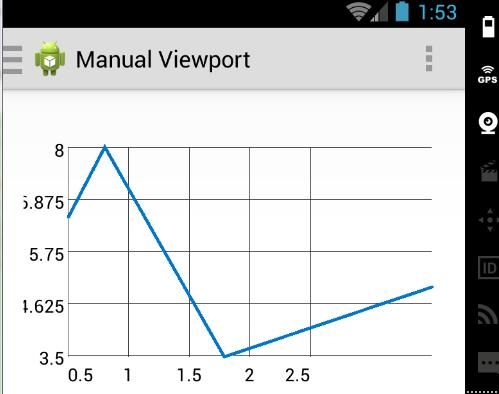
设置图表可以缩放:
// enable scaling
        graph.getViewport().setScalable(true);
设置Y轴可以Auto,图表可以横向滑动:
// enable scrolling
        graph.getViewport().setScrollable(true);
// set second scale
        graph.getSecondScale().addSeries(series2);
        // the y bounds are always manual for second scale
        graph.getSecondScale().setMinY(0);
        graph.getSecondScale().setMaxY(100);
        series2.setColor(Color.RED);
        graph.getGridLabelRenderer().setVerticalLabelsSecondScaleColor(Color.RED);

        // legend
        series.setTitle("foo");
        series2.setTitle("bar");
        graph.getLegendRenderer().setVisible(true);
        graph.getLegendRenderer().setAlign(LegendRenderer.LegendAlign.TOP);

        graph.getViewport().setBackgroundColor(Color.GRAY);
使用 staticLables:
 // use static labels for horizontal and vertical labels
        StaticLabelsFormatter staticLabelsFormatter = new StaticLabelsFormatter(graph);
        staticLabelsFormatter.setHorizontalLabels(new String[] {"old", "middle", "new"});
        staticLabelsFormatter.setVerticalLabels(new String[] {"low", "middle", "high"});
        graph.getGridLabelRenderer().setLabelFormatter(staticLabelsFormatter);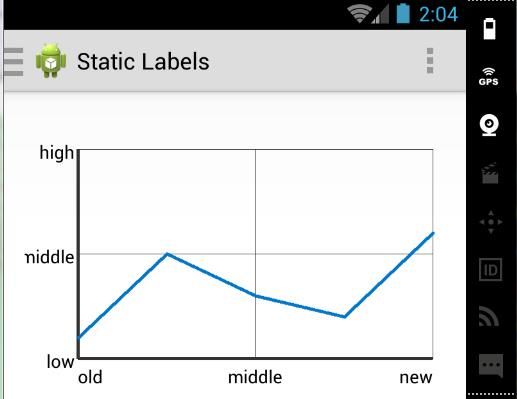
设置轴Lables:
 // titles
        graph.setTitle("Chart Title");
        graph.getGridLabelRenderer().setVerticalAxisTitle("Vertical Axis");
        graph.getGridLabelRenderer().setHorizontalAxisTitle("Horizontal Axis");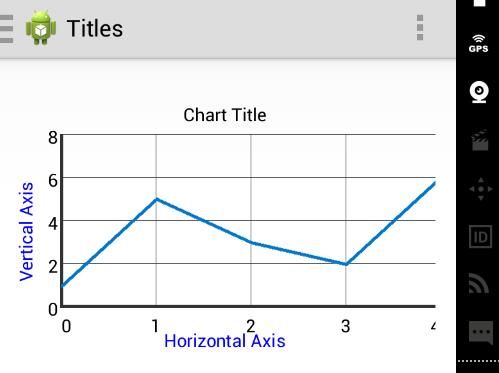
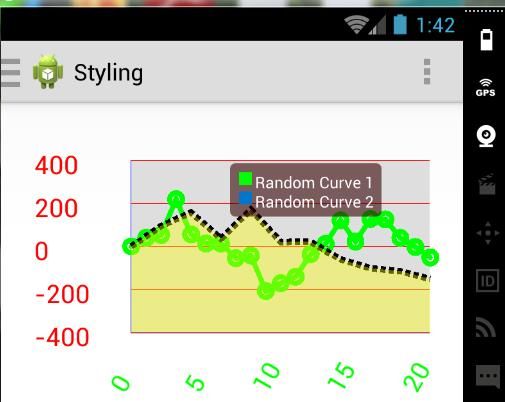
标签、背景色、字体、字大小、颜色....Styling:
 // styling grid/labels
        graph.getGridLabelRenderer().setGridColor(Color.RED);
        graph.getGridLabelRenderer().setHighlightZeroLines(false);
        graph.getGridLabelRenderer().setHorizontalLabelsColor(Color.GREEN);//水平轴字体颜色
        graph.getGridLabelRenderer().setVerticalLabelsColor(Color.RED);//垂直轴字颜色
        graph.getGridLabelRenderer().setVerticalLabelsAlign(Paint.Align.LEFT);
        graph.getGridLabelRenderer().setLabelVerticalWidth(150);
        graph.getGridLabelRenderer().setTextSize(40);//字大小
        graph.getGridLabelRenderer().setGridStyle(GridLabelRenderer.GridStyle.HORIZONTAL);//表格样式,水平线
        graph.getGridLabelRenderer().reloadStyles();
        graph.getGridLabelRenderer().setHorizontalLabelsAngle(120);//水平轴标签倾斜角


        // styling viewport
        graph.getViewport().setBackgroundColor(Color.argb(255, 222, 222, 222));//图表背景色
        graph.getViewport().setDrawBorder(true);
        graph.getViewport().setBorderColor(Color.BLUE);

        // styling series
        series.setTitle("Random Curve 1");
        series.setColor(Color.GREEN);
        series.setDrawDataPoints(true);
        series.setDataPointsRadius(10);
        series.setThickness(8);

        series2.setTitle("Random Curve 2");
        series2.setDrawBackground(true);
        series2.setBackgroundColor(Color.argb(100, 255, 255, 0));
        Paint paint = new Paint();
        paint.setStyle(Paint.Style.STROKE);
        paint.setStrokeWidth(10);
        paint.setPathEffect(new DashPathEffect(new float[]{8, 5}, 0));
        series2.setCustomPaint(paint);

        // styling legend 注释每条线代表什么
        graph.getLegendRenderer().setVisible(true);
        graph.getLegendRenderer().setTextSize(25);
        graph.getLegendRenderer().setBackgroundColor(Color.argb(150, 50, 0, 0));
        graph.getLegendRenderer().setTextColor(Color.WHITE);
        //graph.getLegendRenderer().setAlign(LegendRenderer.LegendAlign.TOP);
        //graph.getLegendRenderer().setMargin(30);
        graph.getLegendRenderer().setFixedPosition(150, 0);