无人驾驶:Term-1-p4-advanced-lane-lines
简介
p4也是车道检测,可以说是p1的升级版。p1只是使用了简单的边缘检测和直线检测进行直线车道信息提取,并未考虑摄像头造成的畸变以及车道不是直线的时候如何进行车道检测,这节课在之前的基础上进行了延伸,过程中会用到更多计算机视觉处理技术。
处理流程
处理流程如下所示:
棋盘标定
在使用摄像设备进行图像拍摄的时候往往会有畸变误差,这些畸变误差分为两类:
径向畸变:由于透镜形状等原因造成,距离透镜光学中心越近畸变越小,越靠近透镜边缘畸变越严重。
切向畸变:由于摄像设备安装时不完全平行于图像平面造成的;
消除畸变可以采用棋盘标定来实现,通过检测棋盘的角点,获取校正系数,将其保存,用于后续实际拍摄图像的畸变校正。
代码如下
#coding:utf-8
import cv2
import numpy as np
import glob
import matplotlib.pyplot as plt
import pickle

#摄像头校正
def camera_calibration():
    #横向角点数量
    nx = 9
    #纵向角点数量
    ny = 6
    #获取角点坐标
    objp = np.zeros((nx*ny,3),np.float32)
    #赋值x,y,默认z=0
    objp[:,:2] = np.mgrid[0:nx,0:ny].transpose(2,1,0).reshape(-1,2)

    objpoints = []
    imgpoints = []

    images = glob.glob("./camera_cal/calibration*.jpg")
    count = 0
    plt.figure(figsize=(12,8))
    for fname in images:
        img = cv2.imread(fname)
        gray = cv2.cvtColor(img,cv2.COLOR_BGR2GRAY)
        #标记棋盘角点
        ret,corners = cv2.findChessboardCorners(gray,(nx,ny),None)

        if ret == True:
            objpoints.append(objp)
            imgpoints.append(corners)
            #角点图
            img_cor = cv2.drawChessboardCorners(img,(nx,ny),corners,ret)
            #画图
            plt.subplot(4,5,count+1)
            plt.axis('off')
            plt.title(fname.split('/')[-1])
            plt.imshow(img_cor)
            count += 1
            write_name = './corners_found/corners_'+fname.split('/')[-1];
            cv2.imwrite(write_name,img)
    plt.show()
    return objpoints,imgpoints

#保存校正系数等
def save_parameters(objpoints,imgpoints):
    img = cv2.imread('./camera_cal/calibration1.jpg')
    img_size = (img.shape[1],img.shape[0])
    ret,mtx,dist,rvecs,tvecs = cv2.calibrateCamera(objpoints,imgpoints,img_size,None,None)
    dist_pickle = {}
    dist_pickle['mtx'] = mtx
    dist_pickle['dist'] = dist
    pickle.dump(dist_pickle,open('./output_images/camera_mtx_dist.p','wb'))
    print 'parameters saved'


def main():
    objpoints,imgpoints = camera_calibration()
    save_parameters(objpoints,imgpoints)

if __name__=='__main__':
    main()
角点标记的效果如下:
径向畸变校正
先展示一下未处理过的照片和畸变校正后的照片效果
可以看到左图边缘被弯曲的线条,在右图中被修正为平行线条。对于实际道路的图片,效果如下:
代码示例如下:
#coding:utf-8
import cv2
import numpy as np
import pickle
import matplotlib.pyplot as plt
#读取校正系数
def load_undistort_parameter(path = './output_images/camera_mtx_dist.p'):
    with open(path) as f:
        data = pickle.load(f)
        return data['mtx'],data['dist']
#消除畸变
def undistort(img,mtx,dist):
    return cv2.undistort(img,mtx,dist,None,mtx)
#展示效果图
def show_undistorted_image(mtx,dist,path = './camera_cal/calibration1.jpg'):
    img = cv2.imread(path)
    undst = undistort(img,mtx,dist)
    #为了显示把BGR格式转为RGB格式
    img = cv2.cvtColor(img,cv2.COLOR_BGR2RGB)
    undst = cv2.cvtColor(undst,cv2.COLOR_BGR2RGB)
    plt.figure(figsize=(200,200))
    plt.subplot(1,2,1)
    plt.title('origin image')
    plt.imshow(img)
    plt.subplot(1,2,2)
    plt.title('undistort image')
    plt.imshow(undst)
    plt.show()

def main():
    mtx,dist = load_undistort_parameter()
    show_undistorted_image(mtx,dist)
    show_undistorted_image(mtx,dist,'./test_images/test1.jpg')

if __name__=='__main__':
    main()
透视畸变校正
车载摄像头是固定在车上的,由于拍摄视角问题(摄像头与道路不垂直),拍摄出的照片有透视畸变,即近大远小,和美术的透视原理类似。
透视变换可以消除透视畸变,简而言之就是转化为鸟瞰图。其原理如下:取得畸变图像的4个点坐标和目标图像的4个点坐标,通过两组坐标计算出透视变换的变换矩阵,之后对整个图像执行变换,就实现了对图像的校正。
畸变图像需要进行透视变换的区域坐标分别为(580,460),(740,460),(280,680),(1050,680),在图上的区域如下
透视变换代码如下
def perspective_transform(path = './test_images/test6.jpg'):
    image = cv2.imread(path)
    img_h = image.shape[0]
    img_w = image.shape[1]
    print img_h,img_w
    #原图像待变换区域顶点坐标
    src = np.float32([left_up,left_down,right_up,right_down])
    #目标区域顶点坐标
    dst = np.float32([[200,0],[200,680],[1000,0],[1000,680]])
    #求得变换矩阵
    M = cv2.getPerspectiveTransform(src,dst)
    #进行透视变换
    warped = cv2.warpPerspective(image,M,(img_w,img_h),flags=cv2.INTER_NEAREST)
    return img_as_ubyte(warped),M
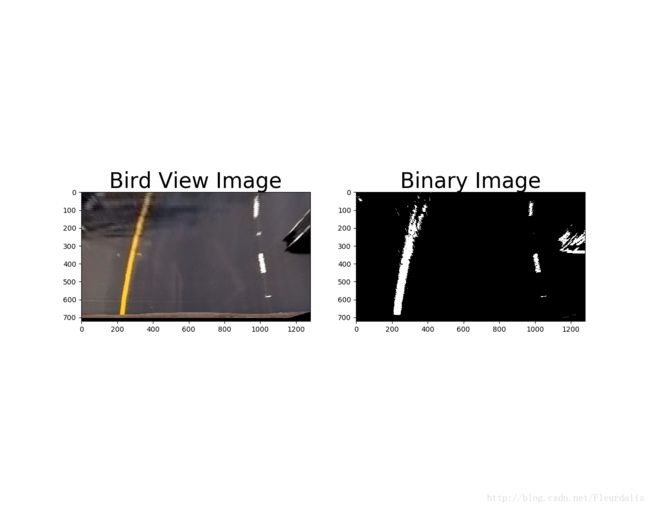
经过透视变换,图像转换为
边缘检测
与p1类似若想提取车道信息,需要二值化处理、边缘检测、roi区域提取,但是p4的处理过程会有不同。
对于p1,直接读入灰度图像然后进行canny边缘检测,这样做有两个问题。首先是颜色检测,车道线条往往有不同的颜色,对于RGB格式来说,某些颜色在特定通道下检测效果不好,比如黄色车道线在Blue通道下是这样的

黄色分量在blue通道下辨识度不是很高。为了更好的进行颜色检测,可以把RGB格式转化为HLS格式,即使用色相(Hue)、饱和度(Saturation)、亮度(Lightness)表示颜色,可以获得更好的效果。
第二个问题是canny检测虽然能够获得很好的效果,但是它会把车道外其他部分的边缘提取出来,这些信息对于我们来说并没有用。考虑到车在行驶过程中,车道基本是垂直于车子,所以可以采用sobel算子提取x方向上的梯度,实现垂直方向上车道的检测。
代码如下
def edge_detection(image,sobel_kernel=3,sc_threshold=(110, 255), sx_threshold=(20, 100)):

    img = np.copy(image)
    #转换为hsv格式
    hsv = cv2.cvtColor(img,cv2.COLOR_RGB2HLS).astype(np.float)
    h_channel = hsv[:,:,0]
    l_channel = hsv[:,:,1]
    s_channel = hsv[:,:,2]
    #使用s通道
    channel = s_channel
    #x方向梯度
    sobel_x = cv2.Sobel(channel,cv2.CV_64F,1,0,ksize = sobel_kernel)
    #二值化处理
    scaled_sobel_x = cv2.convertScaleAbs(255*sobel_x/np.max(sobel_x))
    sx_binary = np.zeros_like(scaled_sobel_x)
    #进行边缘检测
    sx_binary[(scaled_sobel_x >= sx_threshold[0]) & (scaled_sobel_x<=sx_threshold[1])] = 1
    s_binary = np.zeros_like(s_channel)
    #进行颜色检测
    s_binary[(channel>=sc_threshold[0]) & (channel<=sc_threshold[1])]=1
    flat_binary = np.zeros_like(sx_binary)
    #颜色和边缘叠加
    flat_binary[(sx_binary == 1) | (s_binary ==1)] =1

    return flat_binary
检测效果如下:
接下来进行roi区域提取
def roi(img,vertices):
    mask = np.zeros_like(img)

    if len(img.shape) >2:
        channel_count = image.shape[2]
        ignore_mask_color=(255,)*channel_count
    else:
        ignore_mask_color = 255

    cv2.fillPoly(mask,vertices,ignore_mask_color)
    masked_image = cv2.bitwise_and(img,mask)
    return masked_image
最后得到的车道图像为
车道标记
上个步骤结束后,我们找到了车道的大致范围,下面需要对这些点进行过滤,然后将其连成车道线。
确定中线范围
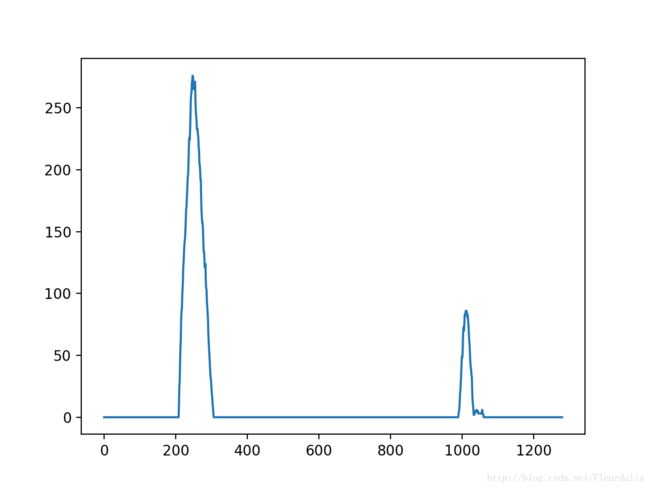
首先找到车道的中线作为搜索的起始点,由于车道有一定的弯曲,我们可以使用图片的下半部分画出直方图,查找其最大值位于x轴的位置。
    #获取直方图,得到车道大致位置
    histogram = np.sum(roi_image[int(roi_image.shape[0]/2):,:],axis=0)
    #输出图像
    out_image = np.dstack((roi_image,roi_image,roi_image)) * 255

    #图像中线x轴的坐标
    midpoint = np.int(histogram.shape[0]/2)
    #图像中线左侧车道x轴基准
    leftx_base = np.argmax(histogram[:midpoint])
    #图像中线右侧车道x轴基准
    rightx_base = np.argmax(histogram[midpoint:]) + midpoint
大致能确定左车道中心线大概在x=250,右车道中心线大概在x=1000的位置。
定义搜索框
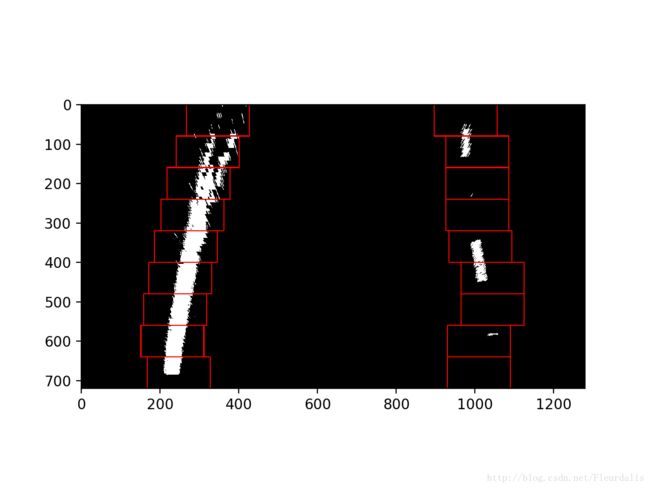
在y轴方向上使用9个搜索框从图片底部向图片上部进行搜索,其宽度为80像素。
    #设置滑动窗口个数
    nwindows = 9
    #窗口高度
    window_height = np.int(roi_image.shape[0]/nwindows)
    #所有非零点坐标
    nonzero = roi_image.nonzero()
过滤非零像素点
把不符合要求的点过滤掉,只保留窗口范围内的非零像素点,并调节搜索中线位置。整个过程如下
    #左车道搜索起始点
    leftx_current = leftx_base
    #右车道搜索起始点
    rightx_current = rightx_base
    #窗口长度2*margin,即搜索中线左右80像素范围内的点
    margin = 80
    #窗口内超过50个点才会改变搜索中线
    minpix = 50
    #左车道窗口内像素点坐标
    left_lane_indices = []
    #右车道窗口内像素点坐标
    right_lane_indices = []


    for window in range(nwindows):
        #窗口上边线y值
        win_y_low = roi_image.shape[0] - (window + 1) * window_height
        #窗口下边线y值
        win_y_high = roi_image.shape[0] - window * window_height
        #窗口左下顶点坐标
        win_xleft_low = leftx_current - margin
        #窗口左上顶点坐标
        win_xleft_high = leftx_current + margin
        #窗口右下顶点坐标
        win_xright_low = rightx_current - margin
        #窗口右上顶点坐标
        win_xright_high = rightx_current + margin
        #画图
        cv2.rectangle(out_image,(win_xleft_low,win_y_low),(win_xleft_high,win_y_high),(255,0,0),2)
        cv2.rectangle(out_image,(win_xright_low,win_y_low),(win_xright_high,win_y_high),(255,0,0),2)
        #挑出左窗口范围内的点
        good_left_indices = ((nonzeroy >= win_y_low) & (nonzeroy < win_y_high)
            & (nonzerox >= win_xleft_low) & (nonzerox < win_xleft_high)).nonzero()[0]
        #挑出右窗口范围内的点
        good_right_indices = ((nonzeroy >= win_y_low) & (nonzeroy < win_y_high)
            & (nonzerox >= win_xright_low) & (nonzerox < win_xright_high)).nonzero()[0]

        left_lane_indices.append(good_left_indices)
        right_lane_indices.append(good_right_indices)

        if len(good_left_indices) > minpix:
            #将左车道搜索中线置为窗口内像素点x坐标的平均值
            leftx_current = np.int(np.mean(nonzerox[good_left_indices]))
        if len(good_right_indices) > minpix:
            #将右车道搜索中线置为窗口内像素点x坐标的平均值
            rightx_current = np.int(np.mean(nonzerox[good_right_indices]))
车道线拟合
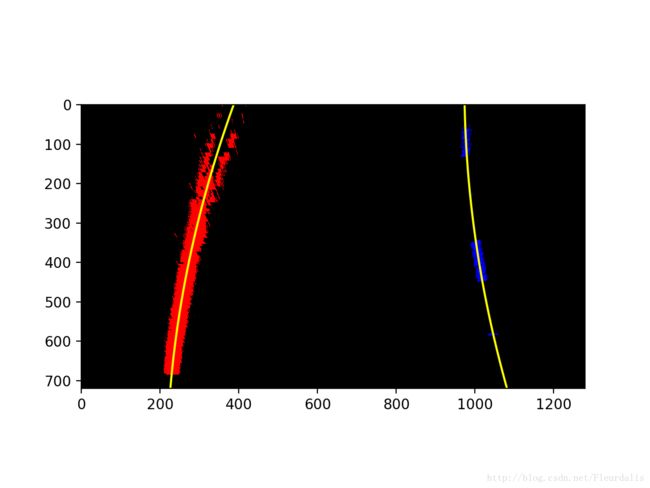
拿到了车道像素点后,使用数学方法对其进行二次函数拟合。为了后续处理,还需要计算拟合曲线上的坐标。效果如下
    #拟合左车道曲线
    left_fit = np.polyfit(lefty,leftx,2)
    #拟合右车道曲线
    right_fit = np.polyfit(righty,rightx,2)
    #y轴的坐标都是确定的,待确定的是x的坐标
    ploty = np.linspace(0,roi_image.shape[0]-1,roi_image.shape[0])
    #根据左车道y的坐标计算x的坐标
    left_fitx = left_fit[0] * ploty ** 2 + left_fit[1] * ploty + left_fit[2]
    #根据右车道y的坐标计算x的坐标
    right_fitx = right_fit[0] * ploty ** 2 + right_fit[1] * ploty + right_fit[2]
标记车道范围
先在鸟瞰图上标记车道范围,然后映射到透视变换前的图像上。
    # 复制一份输出图像
    color_warp = np.zeros_like(out_image).astype(np.uint8)
    pts_left = np.array([np.transpose(np.vstack([left_fitx,ploty]))])
    pts_right = np.array([np.flipud(np.transpose(np.vstack([right_fitx,ploty])))])
    pts = np.hstack((pts_left,pts_right))
    #标记不规则区域
    cv2.fillPoly(color_warp,np.int_([pts]),(0,255,0))
    #还原到原图像,需要用到透视变换矩阵
    newwarp = cv2.warpPerspective(color_warp,np.linalg.inv(M),(original.shape[1],original.shape[0]))
    #叠加图像
    result = cv2.addWeighted(original,1,newwarp,0.3,0)
处理视频
处理完单张图像,处理视频,效果见Term-1-p4-advanced-lane-lines
总结
这节课难度比前几节课略大,需要用到的图像处理手段有些复杂,需要一定时间消化理解,部分细节性技术后续会单开文章专门介绍,这部分代码参考Term-1-p4-advanced-lane-lines


