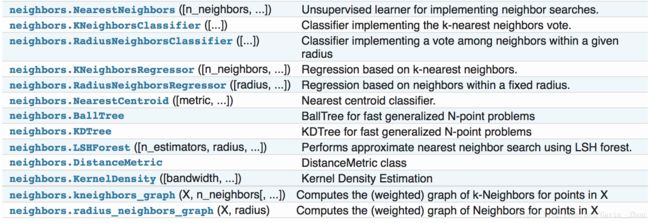
sklearn中的nearest neighbor
KNN介绍
基础原理没什么介绍的,可以参考我的KNN原理和实现,里面介绍了KNN的原理同时使用KNN来进行mnist分类
KNN in sklearn
sklearn是这么说KNN的:
The principle behind nearest neighbor methods is to find a predefined number of training samples closest in distance to the new point, and predict the label from these. The number of samples can be a user-defined constant (k-nearest neighbor learning), or vary based on the local density of points (radius-based neighbor learning). The distance can, in general, be any metric measure: standard Euclidean distance is the most common choice. Neighbors-based methods are known as non-generalizing machine learning methods, since they simply “remember” all of its training data (possibly transformed into a fast indexing structure such as a Ball Tree or KD Tree.).
接口介绍
sklearn.neighbors
主要有两个:
- KNeighborsClassifier(RadiusNeighborsClassifier)
- kNeighborsRegressor (RadiusNeighborsRefressor)
classifier
接口定义
KNeighborsClassifier(n_neighbors=5, weights=’uniform’, algorithm=’auto’, leaf_size=30, p=2, metric=’minkowski’, metric_params=None, n_jobs=1, **kwargs)
参数介绍
需要注意的点就是:
- weights(各个neighbor的权重分配)
- metric(距离的度量)
例子
这次就不写mnist分类了,其实也很简单,官网的教程就可以说明问题了
import numpy as np
import matplotlib.pyplot as plt
from matplotlib.colors import ListedColormap
from sklearn import neighbors, datasets

n_neighbors = 15

# 导入iris数据集
iris = datasets.load_iris()
# iris特征有四个,这里只使用前两个特征来做分类
X = iris.data[:, :2]
# iris的label
y = iris.target

h = .02  # step size in the mesh

# colormap
cmap_light = ListedColormap(['#FFAAAA', '#AAFFAA', '#AAAAFF'])
cmap_bold = ListedColormap(['#FF0000', '#00FF00', '#0000FF'])

for weights in ['uniform', 'distance']:
    # KNN分类器
    clf = neighbors.KNeighborsClassifier(n_neighbors, weights=weights)
    # fit
    clf.fit(X, y)

    # Plot the decision boundary.
    # point in the mesh [x_min, x_max]x[y_min, y_max].
    x_min, x_max = X[:, 0].min() - 1, X[:, 0].max() + 1
    y_min, y_max = X[:, 1].min() - 1, X[:, 1].max() + 1
    xx, yy = np.meshgrid(np.arange(x_min, x_max, h),
                         np.arange(y_min, y_max, h))
    # predict
    Z = clf.predict(np.c_[xx.ravel(), yy.ravel()])

    # Put the result into a color plot
    Z = Z.reshape(xx.shape)
    plt.figure()
    plt.pcolormesh(xx, yy, Z, cmap=cmap_light)

    # Plot also the training points
    plt.scatter(X[:, 0], X[:, 1], c=y, cmap=cmap_bold)
    plt.xlim(xx.min(), xx.max())
    plt.ylim(yy.min(), yy.max())
    plt.title("3-Class classification (k = %i, weights = '%s')"
              % (n_neighbors, weights))

plt.show()
其实非常简单,如果去除画图的代码其实就三行:
- clf = neighbors.KNeighborsClassifier(n_neighbors, weights=weights)
- clf.fit(X, y)
- clf.predict(Z)
如果你的数据不是uniformaly sampled的,你会需要用到RadiusNeighrborsClassifier,使用方法保持一致
regressor
大部分说KNN其实是说的是分类器,其实KNN还可以做回归,官网教程是这么说的:
Neighbors-based regression can be used in cases where the data labels are continuous rather than discrete variables. The label assigned to a query point is computed based the mean of the labels of its nearest neighbors.
例子
同样是官网的例子
import numpy as np
import matplotlib.pyplot as plt
from sklearn import neighbors

np.random.seed(0)
X = np.sort(5 * np.random.rand(40, 1), axis=0)
T = np.linspace(0, 5, 500)[:, np.newaxis]
y = np.sin(X).ravel()

# Add noise to targets
y[::5] += 1 * (0.5 - np.random.rand(8))

n_neighbors = 5

for i, weights in enumerate(['uniform', 'distance']):
    knn = neighbors.KNeighborsRegressor(n_neighbors, weights=weights)
    y_ = knn.fit(X, y).predict(T)

    plt.subplot(2, 1, i + 1)
    plt.scatter(X, y, c='k', label='data')
    plt.plot(T, y_, c='g', label='prediction')
    plt.axis('tight')
    plt.legend()
    plt.title("KNeighborsRegressor (k = %i, weights = '%s')" % (n_neighbors, weights)

    plt.show()
简单易懂,就不解释了
与classifier一样,如果你的数据不是uniformly sampled的,使用RadiusNeighborsRegressor更加合适
