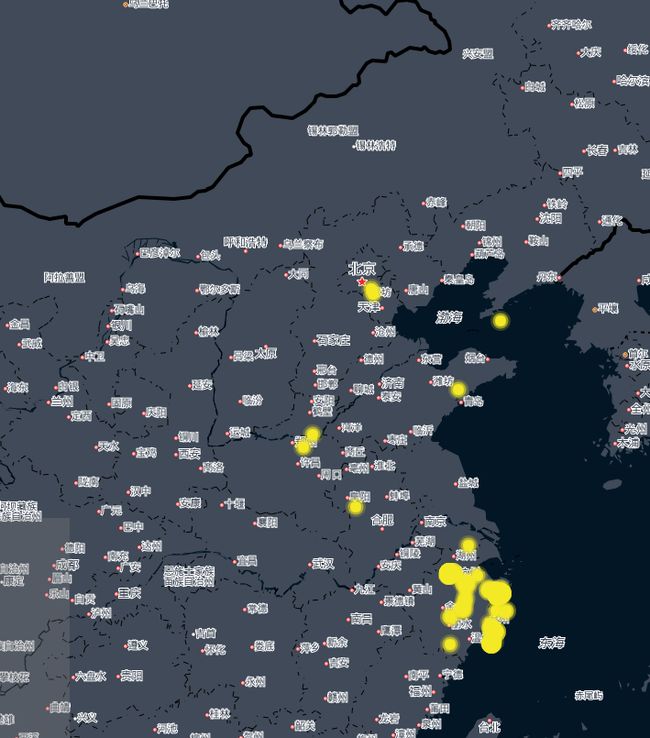
使用Echarts的散点图与百度地图结合显示
最近做的东西需要将数据进行可视化的展示,选用的是Echarts的散点图和百度地图结合起来,将平台上的设备用散点图的形式呈现在百度地图上,因为第一次搞,结合看了下Echarts的官网的案例,成功显示了。
这里查了下官网的要求,需要引入echarts.min.js、bmap.min.js和百度地图的api(这个需要自己去申请开发者账号,具体操作可以百度),具体引入如下所示:
(ak自己申请可得)引入上述js文件后,可以设计一个div用于放置地图,我是如下设置:
然后在js中进行图表的初始化和设置:
// 初始化echarts实例
var myChart = echarts.init(document.getElementById('map_yangan'));
//echarts图表设置配置
var option = {
	//标题设置
    	title: {},
    	tooltip : {
            trigger: 'item'
    	},
    	//百度地图配置
    	bmap: {
    	    //中心坐标,如下定义为北京
            center: [104.114129, 37.550339],
            //地图初始显示的缩放大小
            zoom: 6,
            roam: true,
            //地图上的一些特征属性设置
            mapStyle: {
                styleJson: [{
                    'featureType': 'water',
                    'elementType': 'all',
                    'stylers': {
                        'color': '#021625'
                    }
                }, {
                    'featureType': 'land',
                    'elementType': 'all',
                    'stylers': {
                        'color': '#404a59'
                    }
                }, {
                    'featureType': 'railway',
                    'elementType': 'all',
                    'stylers': {
                        'visibility': 'off'
                    }
                }, {
                    'featureType': 'highway',
                    'elementType': 'all',
                    'stylers': {
                        'color': '#404a59'
                    }
                }, {
                    'featureType': 'highway',
                    'elementType': 'labels',
                    'stylers': {
                        'visibility': 'off'
                    }
                }, {
                    'featureType': 'arterial',
                    'elementType': 'geometry',
                    'stylers': {
                        'color': '#404a59'
                    }
                }, {
                    'featureType': 'arterial',
                    'elementType': 'geometry.fill',
                    'stylers': {
                        'color': '#404a59'
                    }
                }, {
                    'featureType': 'poi',
                    'elementType': 'all',
                    'stylers': {
                        'visibility': 'off'
                    }
                }, {
                    'featureType': 'green',
                    'elementType': 'all',
                    'stylers': {
                        'visibility': 'off'
                    }
                }, {
                    'featureType': 'subway',
                    'elementType': 'all',
                    'stylers': {
                        'visibility': 'off'
                    }
                }, {
                    'featureType': 'manmade',
                    'elementType': 'all',
                    'stylers': {
                        'color': '#404a59'
                    }
                }, {
                    'featureType': 'local',
                    'elementType': 'all',
                    'stylers': {
                        'color': '#404a59'
                    }
                }, {
                    'featureType': 'arterial',
                    'elementType': 'labels',
                    'stylers': {
                        'visibility': 'off'
                    }
                }, {
                    'featureType': 'boundary',
                    'elementType': 'all',
                    'stylers': {
                        'color': '#000000'
                    }
                }, {
                    'featureType': 'building',
                    'elementType': 'all',
                    'stylers': {
                        'color': '#404a59'
                    }
                }, {
                    'featureType': 'label',
                    'elementType': 'labels.text.fill',
                    'stylers': {
                        'color': '#404a59'
                    }
                }]
            }
    	},
    	//散点数据的配置
    	series : [
        {
            name: '设备分布',
            type: 'effectScatter',
            coordinateSystem: 'bmap',
            //数据载入,这里需要自己定义自己的数据,主要是[{name : ***, value : ***}]
            data: res,
            symbolSize: 10,
            //配置标签的显示
            label: {
                normal: {
                    formatter: '{b}',
                    position: 'right',
                    show: false
                },
                emphasis: {
                    show: true
                }
            },
            //配置散点的颜色
            itemStyle: {
                normal: {
                    shadowBlur: 2,
                    shadowColor: '#f4e925',
                    color: '#f4e925'
                }
            }
        }

    	]
};
// 使用刚指定的配置项和数据显示图表。
myChart.setOption(option);
然后显示效果如图所示:
