mpAndroidChart 柱状图一览(中文斜体,横向柱状图,叠层柱状图,固定宽度左右滑动)
效果图:
先上自定义view,因为要把所有的方法写在activity里 实在是太麻烦了,其实就是一个工具类。
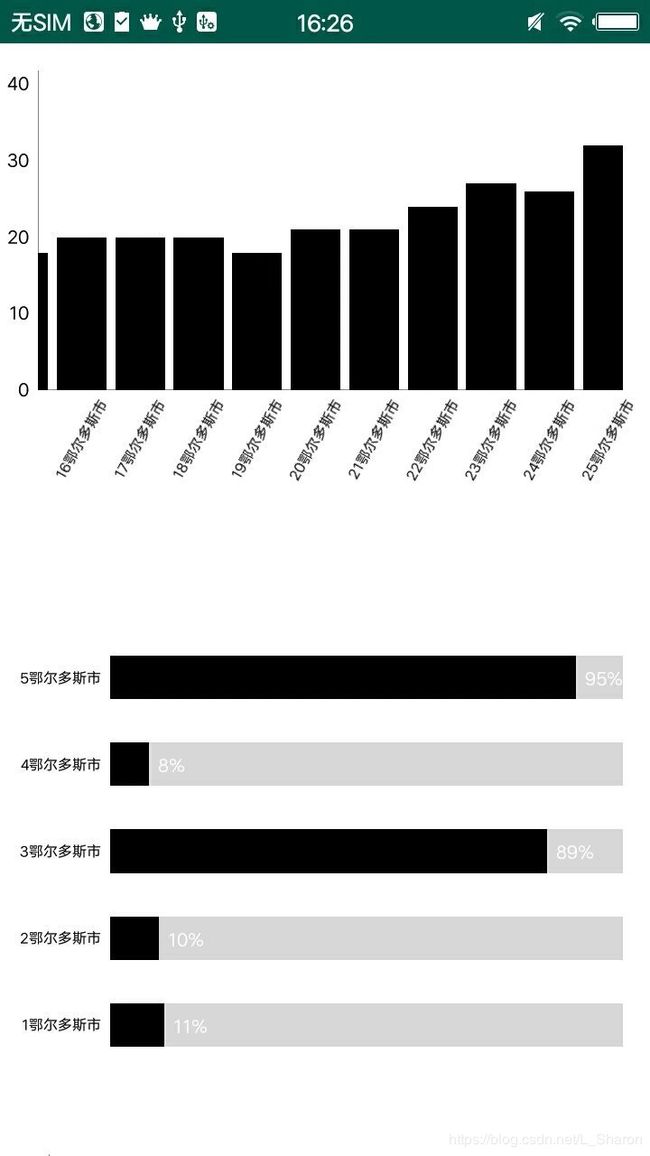
第一个 普通柱状图
要求是固定宽度左右滑动,没有网格,长文字斜展示
public class MBarChart extends BarChart {

    BChartMarkerView markerView;

    public MBarChart(Context context) {
        super(context);
    }

    public MBarChart(Context context, AttributeSet attrs) {
        super(context, attrs);
    }

    public MBarChart(Context context, AttributeSet attrs, int defStyle) {
        super(context, attrs, defStyle);

    }

    private void initSetting() {
        /*xy轴设置*/
        //x轴设置显示位置在底部
        mXAxis.setPosition(XAxis.XAxisPosition.BOTTOM);
        mXAxis.setGranularity(1f);
        //mXAxis.setCenterAxisLabels(true);
        mXAxis.setLabelCount(7);
        mXAxis.setTextSize(8f);
        //文字倾斜展示
        mXAxis.setLabelRotationAngle(-60);
        //保证y轴从0开始 不然会上移一点
        mAxisLeft.setAxisMinimum(0f);
        mAxisRight.setAxisMinimum(0f);
        mAxisRight.enableGridDashedLine(10f,10f,10f);
        //不显示X轴 Y轴线条
        mXAxis.setDrawAxisLine(true);
        mXAxis.setDrawGridLines(false);
        mXAxis.setGridColor(Color.TRANSPARENT);

        //mAxisLeft.setDrawAxisLine(false);
        mAxisRight.setDrawAxisLine(false);
        mAxisLeft.setDrawGridLines(false);
        mAxisRight.setDrawGridLines(false);
        //不显示左侧Y轴
        mAxisRight.setEnabled(false);
        /*折现图例 标签 设置*/
        mLegend.setForm(Legend.LegendForm.LINE);
        mLegend.setTextSize(0f);
        //显示位置
        mLegend.setHorizontalAlignment(Legend.LegendHorizontalAlignment.LEFT);
        mLegend.setOrientation(Legend.LegendOrientation.HORIZONTAL);
        /*是否绘制在表里*/
        mLegend.setDrawInside(false);
        //不显示右下角描述内容
        mDescription.setEnabled(false);
        setDescription(mDescription);

    }

    public void setBarDataSet( int color, int size, final List list,String[] v) {
        BarDataSet barDataSet=new BarDataSet(list,"");
        barDataSet.setColor(color);
        barDataSet.setFormLineWidth(0f);
        barDataSet.setFormSize(0f);
        barDataSet.setDrawValues(false);
        BarData barData=new BarData(barDataSet);
        barData.setValueTextSize(10f);

        ValueFormatter xAxisFormatter = new DayAxisValueFormatter(v,DayAxisValueFormatter.DAY);
        mXAxis.setValueFormatter(xAxisFormatter);

        if (size<10){
            barData.setBarWidth((float) size/10f);
            setData(barData);
        }else {
            setData(barData);
            setChartData(size);
        }
        setChartEffect();
        initSetting();
    }

    /*设置图表效果*/
    private void setChartEffect(){
        //不可以手动缩放
        setScaleXEnabled(false);
        setScaleYEnabled(false);
        setScaleEnabled(false);

        //背景颜色
        setBackgroundColor(Color.WHITE);
        //不显示图表网格
        setDrawGridBackground(false);
        setDrawBorders(false);
        //背景阴影
        setDrawBarShadow(false);
        setHighlightFullBarEnabled(false);
        //显示柱图底层阴影
        setDrawBarShadow(false);
        //设置动画效果
        animateY(1000,Easing.EasingOption.Linear);
        animateX(1000,Easing.EasingOption.Linear);
    }


    /* marker */
    public void setMarkerView(Context context) {
        markerView=new BChartMarkerView(context);
        setMarker(markerView);
    }

    /*固定宽*/
    private void setChartData(int size){
        Matrix m = new Matrix();
        m.postScale(scaleNum(size), 1f);//两个参数分别是x,y轴的缩放比例。例如:将x轴的数据放大为之前的1.5倍
        getViewPortHandler().refresh(m, this, false);//将图表动画显示之前进行缩放
    }
    //30个横坐标时,缩放4f是正好的。
    private float scalePercent = 3f/30f;

    private float scaleNum(int xCount){
        return xCount * scalePercent;
    }

}
第二个 横向柱状图
要求是没有网格 有阴影
package com.example.lmy.cardkt.chart;

import android.content.Context;
import android.graphics.Color;
import android.graphics.Matrix;
import android.util.AttributeSet;

import com.github.mikephil.charting.animation.Easing;
import com.github.mikephil.charting.charts.HorizontalBarChart;
import com.github.mikephil.charting.components.Legend;
import com.github.mikephil.charting.components.XAxis;
import com.github.mikephil.charting.data.BarData;
import com.github.mikephil.charting.data.BarDataSet;
import com.github.mikephil.charting.data.BarEntry;
import com.github.mikephil.charting.data.Entry;
import com.github.mikephil.charting.formatter.IValueFormatter;
import com.github.mikephil.charting.utils.ViewPortHandler;

import java.util.List;

public class HorizontalBarChartView extends HorizontalBarChart {

    public HorizontalBarChartView(Context context) {
        super(context);
    }

    public HorizontalBarChartView(Context context, AttributeSet attrs) {
        super(context, attrs);
    }

    public HorizontalBarChartView(Context context, AttributeSet attrs, int defStyle) {
        super(context, attrs, defStyle);
    }


    private void initSetting() {
        /*xy轴设置*/
        //x轴设置显示位置在底部
        mXAxis.setPosition(XAxis.XAxisPosition.BOTTOM);
        mXAxis.setGranularity(1f);
        mXAxis.setLabelCount(7);
        mXAxis.setTextSize(8f);
        //保证y轴从0开始 不然会上移一点
        mAxisLeft.setAxisMinimum(0f);
        mAxisRight.setAxisMinimum(0f);
        mAxisRight.enableGridDashedLine(10f,10f,10f);
        //不显示X轴 Y轴线条
        mXAxis.setDrawAxisLine(false);
        mXAxis.setDrawGridLines(false);
        mXAxis.setGridColor(Color.TRANSPARENT);

        //mAxisLeft.setDrawAxisLine(false);
        mAxisRight.setDrawAxisLine(false);
        mAxisLeft.setDrawGridLines(false);
        mAxisRight.setDrawGridLines(false);
        //不显示左侧Y轴
        mAxisRight.setEnabled(false);
        mAxisLeft.setEnabled(false);
        /*折现图例 标签 设置*/
        mLegend.setForm(Legend.LegendForm.LINE);
        mLegend.setTextSize(0f);
        //显示位置
        mLegend.setHorizontalAlignment(Legend.LegendHorizontalAlignment.LEFT);
        mLegend.setOrientation(Legend.LegendOrientation.HORIZONTAL);
        /*是否绘制在表里*/
        mLegend.setDrawInside(false);
        //不显示右下角描述内容
        mDescription.setEnabled(false);
        setDescription(mDescription);

    }


    /*设置图表效果*/
    private void setChartEffect(){
        //不可以手动缩放
        setScaleXEnabled(false);
        setScaleYEnabled(false);
        setScaleEnabled(false);

//        //背景颜色
//        setBackgroundColor(Color.WHITE);
        //不显示图表网格
        setDrawGridBackground(false);
        setDrawBorders(false);

        setHighlightFullBarEnabled(false);
        //显示柱图底层阴影
        setDrawBarShadow(true);
        //最大显示值
        //setMaxVisibleValueCount(100);
        //限制长度在图表内部
        setDrawValueAboveBar(true);
        setPinchZoom(false);

        setFitBars(true);
        //设置动画效果
        animateY(1000,Easing.EasingOption.Linear);
        animateX(1000,Easing.EasingOption.Linear);
    }

    /*固定宽*/
    private void setChartData(int size){
        Matrix m = new Matrix();
        m.postScale(scaleNum(size), 1f);//两个参数分别是x,y轴的缩放比例。例如:将x轴的数据放大为之前的1.5倍
        getViewPortHandler().refresh(m, this, false);//将图表动画显示之前进行缩放
    }
    //30个横坐标时,缩放4f是正好的。
    private float scalePercent = 3f/30f;

    private float scaleNum(int xCount){
        return xCount * scalePercent;
    }


    public void setBarDataSet(int color, int size, final List list, String[] v) {
        BarDataSet barDataSet=new BarDataSet(list,"");
        barDataSet.setColor(color);
        barDataSet.setFormLineWidth(0f);
        barDataSet.setFormSize(0f);
        barDataSet.setDrawValues(false);
        BarData barData=new BarData(barDataSet);
        barData.setValueTextSize(10f);

        ValueFormatter xAxisFormatter = new DayAxisValueFormatter(v,DayAxisValueFormatter.DAY);
        mXAxis.setValueFormatter(xAxisFormatter);
        //ValueFormatter dataFormatter = new DayAxisValueFormatter(v,DayAxisValueFormatter.PERCENT);
        barData.setValueFormatter(new IValueFormatter() {
            @Override
            public String getFormattedValue(float value, Entry entry, int dataSetIndex, ViewPortHandler viewPortHandler) {
                return ((int)entry.getY())+"%";
            }
        });
        barData.setValueTextSize(10f);
        barData.setValueTextColor(Color.WHITE);
        barData.setDrawValues(true);
        if (size<6){
            barData.setBarWidth((float) size/10f);
            setData(barData);
        }else {
            setData(barData);
            setChartData(size);
        }
        setChartEffect();
        initSetting();
    }

}
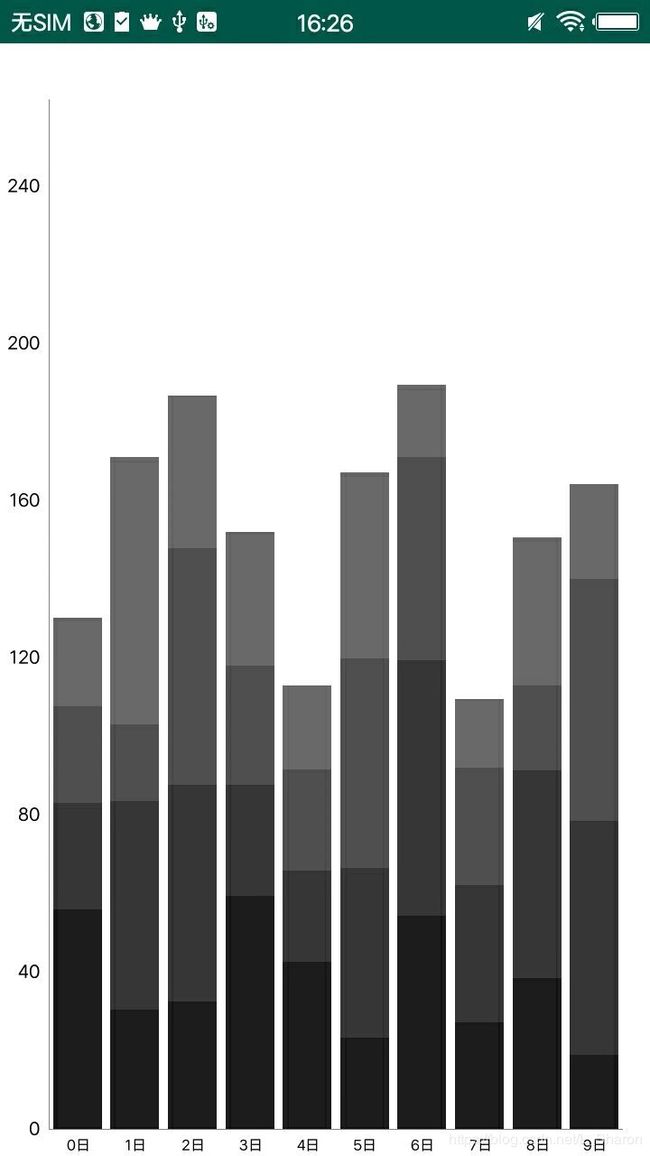
第三个 叠层柱状图
要求是 没有网格 x轴中文
public class MultipleBarChartView extends BarChart {
    private BChartMarkerView markerView;
    public MultipleBarChartView(Context context) {
        super(context);
    }

    public MultipleBarChartView(Context context, AttributeSet attrs) {
        super(context, attrs);
    }

    public MultipleBarChartView(Context context, AttributeSet attrs, int defStyle) {
        super(context, attrs, defStyle);
    }
    /*设置图表效果*/
    private void setChartEffect(){
        //不可以手动缩放
        setScaleXEnabled(false);
        setScaleYEnabled(false);
        setScaleEnabled(false);

        //背景颜色
        setBackgroundColor(Color.WHITE);
        //不显示图表网格
        setDrawGridBackground(false);
        setDrawBorders(false);
        //背景阴影
        setDrawBarShadow(false);
        setHighlightFullBarEnabled(false);
        //显示柱图底层阴影
        setDrawBarShadow(false);
        //设置动画效果
        animateY(1000,Easing.EasingOption.Linear);
        animateX(1000,Easing.EasingOption.Linear);
    }

    private void initSetting() {
        /*xy轴设置*/
        //x轴设置显示位置在底部
        mXAxis.setPosition(XAxis.XAxisPosition.BOTTOM);
        mXAxis.setGranularity(1f);
        //mXAxis.setCenterAxisLabels(true);
        mXAxis.setLabelCount(7);
        mXAxis.setTextSize(8f);
        //文字倾斜展示
//        mXAxis.setLabelRotationAngle(-60);
        //保证y轴从0开始 不然会上移一点
        mAxisLeft.setAxisMinimum(0f);
        mAxisRight.setAxisMinimum(0f);
        mAxisRight.enableGridDashedLine(10f,10f,10f);
        //不显示X轴 Y轴线条
        mXAxis.setDrawAxisLine(true);
        mXAxis.setDrawGridLines(false);
        mXAxis.setGridColor(Color.TRANSPARENT);

        //mAxisLeft.setDrawAxisLine(false);
        mAxisRight.setDrawAxisLine(false);
        mAxisLeft.setDrawGridLines(false);
        mAxisRight.setDrawGridLines(false);
        //不显示左侧Y轴
        mAxisRight.setEnabled(false);
        /*折现图例 标签 设置*/
        mLegend.setForm(Legend.LegendForm.LINE);
        mLegend.setTextSize(0f);
        //显示位置
        mLegend.setHorizontalAlignment(Legend.LegendHorizontalAlignment.LEFT);
        mLegend.setOrientation(Legend.LegendOrientation.HORIZONTAL);
        /*是否绘制在表里*/
        mLegend.setDrawInside(false);
        mLegend.setEnabled(false);
        //不显示右下角描述内容
        mDescription.setEnabled(false);
        setDescription(mDescription);

    }

    /*固定宽*/
    private void setChartData(int size){
        Matrix m = new Matrix();
        m.postScale(scaleNum(size), 1f);//两个参数分别是x,y轴的缩放比例。例如:将x轴的数据放大为之前的1.5倍
        getViewPortHandler().refresh(m, this, false);//将图表动画显示之前进行缩放
    }

    /* marker */
    public void setMarkerView(Context context) {
        markerView=new BChartMarkerView(context);
        setMarker(markerView);
    }
    //30个横坐标时,缩放4f是正好的。
    private float scalePercent = 3f/30f;

    private float scaleNum(int xCount){
        return xCount * scalePercent;
    }

    private int[] getColors() {
        int stacksize = 4;
        //有尽可能多的颜色每项堆栈值
        int[] colors = new int[stacksize];
        colors[0]=Color.rgb(28,28,28);
        colors[1]=Color.rgb(54,54,54);
        colors[2]=Color.rgb(79,79,79);
        colors[3]=Color.rgb(105,105,105);

        return colors;
    }

    public void setBarDataSet(int color, final List list, String[] v) {
        BarDataSet barDataSet=new BarDataSet(list,"");
        barDataSet.setColors(getColors());
        barDataSet.setFormLineWidth(0f);
        barDataSet.setFormSize(0f);
        barDataSet.setDrawValues(false);
        BarData barData=new BarData(barDataSet);
        barData.setValueTextSize(10f);

        ValueFormatter xAxisFormatter = new DayAxisValueFormatter(v,DayAxisValueFormatter.DAY);
        mXAxis.setValueFormatter(xAxisFormatter);
        if (list.size()<6){
            barData.setBarWidth((float) list.size()/10f);
            setData(barData);
        }else {
            setData(barData);
            setChartData(list.size());
        }
        setChartEffect();
        initSetting();
    }

}
有个base类是mpAndroidchart demo里的
package com.example.lmy.cardkt.chart;

import com.github.mikephil.charting.components.AxisBase;
import com.github.mikephil.charting.data.BarEntry;
import com.github.mikephil.charting.data.BubbleEntry;
import com.github.mikephil.charting.data.CandleEntry;
import com.github.mikephil.charting.data.Entry;
import com.github.mikephil.charting.data.PieEntry;
import com.github.mikephil.charting.data.RadarEntry;
import com.github.mikephil.charting.formatter.IAxisValueFormatter;
import com.github.mikephil.charting.formatter.IValueFormatter;
import com.github.mikephil.charting.utils.ViewPortHandler;

/**
 * Class to format all values before they are drawn as labels.
 */
public abstract class ValueFormatter implements IAxisValueFormatter, IValueFormatter {

    /**
     * DO NOT USE, only for backwards compatibility and will be removed in future versions.
     *
     * @param value the value to be formatted
     * @param axis  the axis the value belongs to
     * @return formatted string label
     */
    @Override
    @Deprecated
    public String getFormattedValue(float value, AxisBase axis) {
        return getFormattedValue(value);
    }

    /**
     * DO NOT USE, only for backwards compatibility and will be removed in future versions.
     * @param value           the value to be formatted
     * @param entry           the entry the value belongs to - in e.g. BarChart, this is of class BarEntry
     * @param dataSetIndex    the index of the DataSet the entry in focus belongs to
     * @param viewPortHandler provides information about the current chart state (scale, translation, ...)
     * @return formatted string label
     */
    @Override
    @Deprecated
    public String getFormattedValue(float value, Entry entry, int dataSetIndex, ViewPortHandler viewPortHandler) {
        return getFormattedValue(value);
    }

    /**
     * Called when drawing any label, used to change numbers into formatted strings.
     *
     * @param value float to be formatted
     * @return formatted string label
     */
    public String getFormattedValue(float value) {
        return String.valueOf(value);
    }

    /**
     * Used to draw axis labels, calls {@link #getFormattedValue(float)} by default.
     *
     * @param value float to be formatted
     * @param axis  axis being labeled
     * @return formatted string label
     */
    public String getAxisLabel(float value, AxisBase axis) {
        return getFormattedValue(value);
    }

    /**
     * Used to draw bar labels, calls {@link #getFormattedValue(float)} by default.
     *
     * @param barEntry bar being labeled
     * @return formatted string label
     */
    public String getBarLabel(BarEntry barEntry) {
        return getFormattedValue(barEntry.getY());
    }

    /**
     * Used to draw stacked bar labels, calls {@link #getFormattedValue(float)} by default.
     *
     * @param value        current value to be formatted
     * @param stackedEntry stacked entry being labeled, contains all Y values
     * @return formatted string label
     */
    public String getBarStackedLabel(float value, BarEntry stackedEntry) {
        return getFormattedValue(value);
    }

    /**
     * Used to draw line and scatter labels, calls {@link #getFormattedValue(float)} by default.
     *
     * @param entry point being labeled, contains X value
     * @return formatted string label
     */
    public String getPointLabel(Entry entry) {
        return getFormattedValue(entry.getY());
    }

    /**
     * Used to draw pie value labels, calls {@link #getFormattedValue(float)} by default.
     *
     * @param value    float to be formatted, may have been converted to percentage
     * @param pieEntry slice being labeled, contains original, non-percentage Y value
     * @return formatted string label
     */
    public String getPieLabel(float value, PieEntry pieEntry) {
        return getFormattedValue(value);
    }

    /**
     * Used to draw radar value labels, calls {@link #getFormattedValue(float)} by default.
     *
     * @param radarEntry entry being labeled
     * @return formatted string label
     */
    public String getRadarLabel(RadarEntry radarEntry) {
        return getFormattedValue(radarEntry.getY());
    }

    /**
     * Used to draw bubble size labels, calls {@link #getFormattedValue(float)} by default.
     *
     * @param bubbleEntry bubble being labeled, also contains X and Y values
     * @return formatted string label
     */
    public String getBubbleLabel(BubbleEntry bubbleEntry) {
        return getFormattedValue(bubbleEntry.getSize());
    }

    /**
     * Used to draw high labels, calls {@link #getFormattedValue(float)} by default.
     *
     * @param candleEntry candlestick being labeled
     * @return formatted string label
     */
    public String getCandleLabel(CandleEntry candleEntry) {
        return getFormattedValue(candleEntry.getHigh());
    }

}
然后是中文的文字展示,这是我用到的。根据自己的需求改
package com.example.lmy.cardkt.chart;

/**
 * Created by li on 12/13/18.
 */
public class DayAxisValueFormatter extends ValueFormatter
{
    public static final int DAY=0; //日
    public static final int PERCENT=1; //百分比
    private  String[] mMonths;
    private int type;

    public DayAxisValueFormatter(String[] mMonths,int type) {
        this.mMonths = mMonths;
        this.type=type;
    }

    @Override
    public String getFormattedValue(float value) {
        String s="";

        int days = (int) value;
        switch (type){
            case DAY: s=mMonths[days];break;
            case PERCENT: s=mMonths[days]+"%";break;
        }
        return s;
    }
}
MarkerView就不放了,根据需求自己写吧
然后是重要的xml文件
activity文件
package com.example.lmy.cardkt;

import android.graphics.Color;
import android.support.v7.app.AppCompatActivity;
import android.os.Bundle;
import android.util.Log;

import com.example.lmy.cardkt.chart.HorizontalBarChartView;
import com.example.lmy.cardkt.chart.MBarChart;
import com.example.lmy.cardkt.chart.MultipleBarChartView;
import com.github.mikephil.charting.charts.HorizontalBarChart;
import com.github.mikephil.charting.data.BarDataSet;
import com.github.mikephil.charting.data.BarEntry;
import com.github.mikephil.charting.data.Entry;
import com.github.mikephil.charting.highlight.Highlight;
import com.github.mikephil.charting.listener.OnChartValueSelectedListener;

import java.util.ArrayList;
import java.util.List;
import java.util.Random;

public class MainActivity extends AppCompatActivity {

    private MBarChart barChart;
    private HorizontalBarChartView hBarChart;
    private MultipleBarChartView mbChart;
    @Override
    protected void onCreate(Bundle savedInstanceState) {
        super.onCreate(savedInstanceState);
        setContentView(R.layout.activity_main);
        initBarChart();
        initHBarChart();
        initMBarChart();
    }

    private void initMBarChart() {
        mbChart=findViewById(R.id.mb_chart);
        List list=new ArrayList<>();
        String[] values=new String[30];
        for (int i=0;i<30;i++){
            float mult = (50 + 1);
            float val1 = (float) (Math.random() * mult) + mult / 3;
            float val2 = (float) (Math.random() * mult) + mult / 3;
            float val3 = (float) (Math.random() * mult) + mult / 3;
            float val4 = (float) (Math.random() * mult) + mult / 3;
            list.add(new BarEntry(i, new float[]{val1, val2, val3,val4}));
            values[i]=i+"日";
        }
        mbChart.setBarDataSet(Color.BLACK,list,values);
        mbChart.setMarkerView(this);
        mbChart.setOnChartValueSelectedListener(new OnChartValueSelectedListener() {
            @Override
            public void onValueSelected(Entry e, Highlight h) {
                Log.d("TAG",e.getY()+"---" +h.getY());
            }

            @Override
            public void onNothingSelected() {

            }
        });
    }

    private void initHBarChart() {
        hBarChart=findViewById(R.id.hb_chart);
        Random random=new Random();
        List list=new ArrayList<>();
        String[] values=new String[30];
        for (int i=0;i<5;i++){
            BarEntry barEntry=null;
            if (i!=0&&i%2==0){
               barEntry=new BarEntry(i,i+random.nextInt(12)+80);
            }else {
                barEntry=new BarEntry(i,i+random.nextInt(12));
            }
            values[i]=(i+1)+"鄂尔多斯市";
            list.add(barEntry);
        }
        hBarChart.setBarDataSet(Color.BLACK,list.size(),list,values);
    }

    private void initBarChart() {
        barChart=findViewById(R.id.bar_chart);
        Random random=new Random();
        List list=new ArrayList<>();
        String[] values=new String[30];
        for (int i=0;i<30;i++){
            BarEntry barEntry=new BarEntry(i,i+random.nextInt(12));
            values[i]=(i+1)+"鄂尔多斯市";
            list.add(barEntry);
        }
        barChart.setBarDataSet(Color.BLACK,list.size(),list,values);
        barChart.setMarkerView(this);
    }
}
这也算是给自己留个记录,省的以后再写柱状图忘记了。斜体中文不需要在更改源码了。我用的版本是3.0.3是不用改源码。