数字图像处理 第五章 彩色图像处理
- 第五章 彩色图像处理
- MATLAB中彩色图像的表示
- RGB图像
- 索引图像
- 用来处理RGB图像和索引图像的IPT函数
- 转换至其他彩色空间
- NTSC彩色空间
- YCbCr 彩色空间
- HSV彩色空间
- CMY和CMYL彩色空间
- HSI彩色空间
- 彩色变换
- 彩色图像的空间滤波
- 彩色图像平滑
- 彩色图像锐化
- 在RGB向量空间直接处理
- 使用梯度的彩色边缘检测
- 在RGB向量空间中进行图像分割
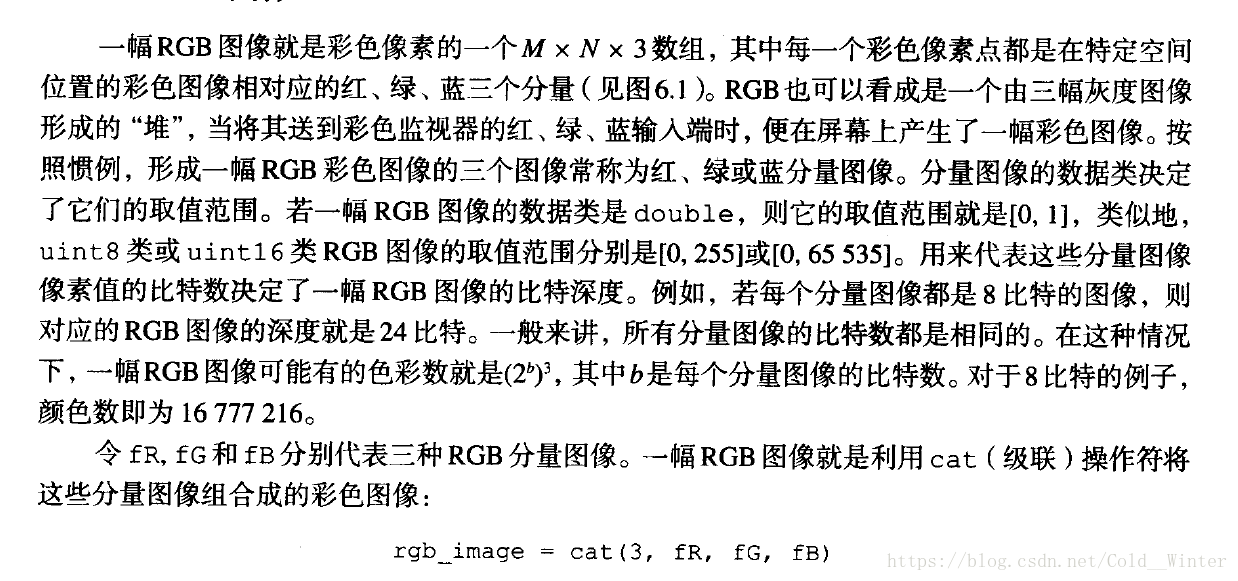
- MATLAB中彩色图像的表示
第五章 彩色图像处理
MATLAB中彩色图像的表示
RGB图像
通常能够从任何透视方向观察这个彩色立方体是很有用的。函数rgbcube就用于这一目的
rgbcube( vx, vy, vz);索引图像
要显示一幅索引图像,可用
>> imshow(X, map);或者
>> image(X);
>> colormap(map);
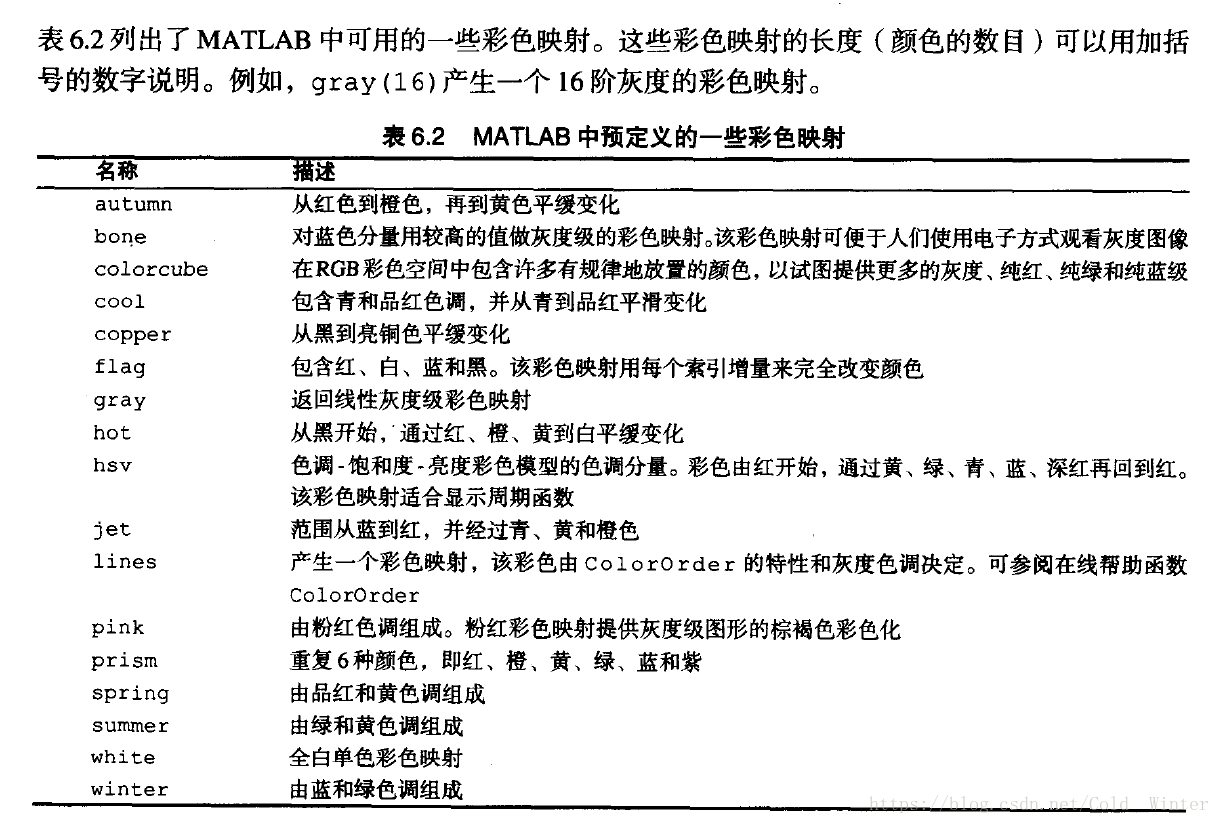
用来处理RGB图像和索引图像的IPT函数
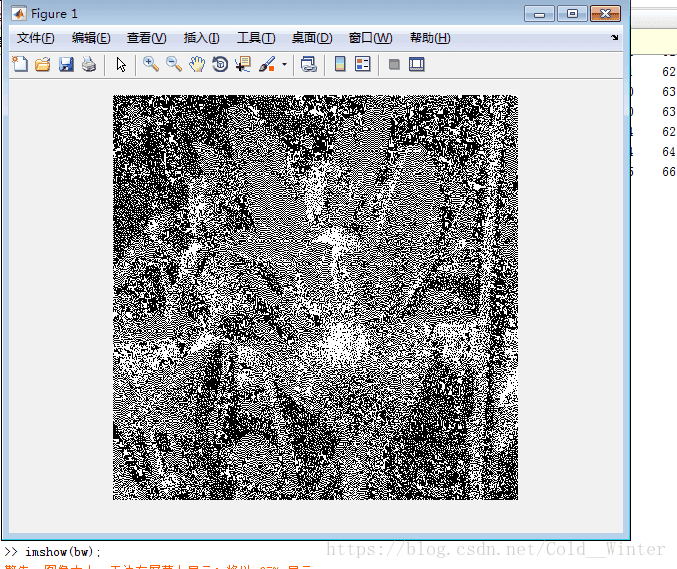
函数dither 可用于灰度图像和彩色图像。在灰度图像的情况下,“抖动”调色试图用在白色背景上产生黑点的二值图像来得到灰色调。语法:
bw = dither(gray_image);原:
处理后(一幅二值图像):
函数grayslice的语法:
X = grayslice(gray_image,n);函数gray2ind的用法:
[X, map] = gray2ind(gray_image, n);函数ind2gray语法:
gray_image = ind2gray(X, map);函数ind2rgb:
rgb_image = ind2rgb(X, map);最后rgb2gray函数:
gray_image = rgb2gray(rgb_image);该函数将一幅RGB图像转换成一幅灰度图像。输入的RGB图像可以是uint8类、uint16类或double 类,输出图像与输入图像是相同类
转换至其他彩色空间
NTSC彩色空间
函数rgb2ntsc可执行这样的变换:
yiq_image = rgb2ntsc(rgb_image);YCbCr 彩色空间
转换函数是
ycbcr_image = rgb2ycbcr(rgb_image);输入输出是相同类型
YCbCr 转RGB:
rgb_image = ycbCr2rgb(ycbcr_image);HSV彩色空间
RGB转HSV的函数是rgb2hsv:
hsv_image = rgb2hsv(rgb_image);回转:
rgb_image = hsv2rgb(hsv_image);两个函数输入输出都是double 类
CMY和CMYL彩色空间
RGB转CMY:
cmy_image = umcomplement(rgb_image);回转:
rgb_image = imcomplement(cmy_image)HSI彩色空间
从RGB转换到HSI的一个M函数 :
hsi = rgb2hsi(rgb);回转:
rgb = hsi2rgb(hsi);彩色变换
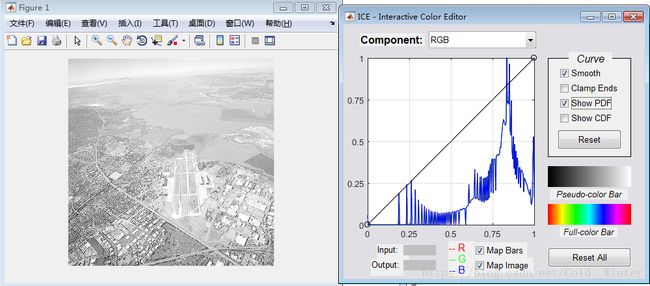
变换函数 ice:
g = ice('Property Name', 'Property Value', ....);其中’Property Name’, ‘Property Value’必须成对出现,并且这些点表示由相应输入对所组成的模式的重复。
变负片:
彩色图像的空间滤波
彩色图像平滑
红,绿,蓝 三色分量
>> f = imread('Fig0604(a)(iris).tif');
>> fR = f(:,:,1);
>> imshow(fR);
>> fG = f(:,:,2);
>> figure,imshow(fG);
>> fB = f(:,:,3);
>> figure,imshow(fB);
色调,饱和度,亮度 分量
>>h = rgb2hsi(f);
>> H = h(:,:,1);
>> S = h(:,:,2);
>> I = h(:,:,3);
>> figure,imshow(H);
>> figure,imshow(S);
>> figure,imshow(I);
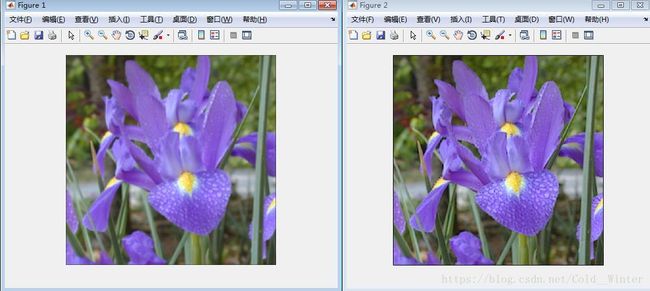
图像平滑:
>> f = imread('Fig0604(a)(iris).tif');
>> w = fspecial('average',25);
>> h = rgb2hsi(f);
>> H = h(:,:,1);S = h(: ,:,2);I = h(:,:,3);
>> I_f = imfilter(I,w,'replicate');
>> S_f = imfilter(S,w,'replicate');
>> H_f = imfilter(H,w,'replicate');
>> h = cat(3,H_f,S_f,I_f);
>> fc = hsi2rgb(h);
>> imshow(f);
>> figure,imshow(fc);
彩色图像锐化
>> w = fspecial('average',5);
>> fb = imfilter(f,w);
>> lapmask = [1 1 1; 1 -8 1; 1 1 ];
>> fen = imsubtract(fb,imfilter(fb,lapmask,'replicate'));
>> imshow(fb);
>> figure,imshow(fen);
在RGB向量空间直接处理
使用梯度的彩色边缘检测
>> f1 = imread('Fig0624(a)RGB2-red.tif');
>> f2 = imread('Fig0624(b)RGB2-green.tif');
>> f3 = imread('Fig0624(c)(RGB2-blue).tif');
f = cat(3,f1,f2,f3);
>> imshow(f);
>> figure,imshow(f1);
>> figure,imshow(f2);
>> figure,imshow(f3);
>> figure,imshow(f);
>> [VG, A, PPG] = colorgrad(f);
>> subplot(121), imshow(VG)
>> subplot(122), imshow(PPG) >> f = imread('Fig0604(a)(iris).tif');
>> [VG, A, PPG] = colorgrad(f);
>> subplot(131), imshow(f)
>> subplot(132), imshow(VG)
>> subplot(133), imshow(PPG) 在RGB向量空间中进行图像分割
>> f = imread('MARS.tif');
>> mask = roipoly(f);
>> red = immultiply(mask, f(:, :, 1));
>> green = immultiply(mask, f(:, :, 2));
>> blue = immultiply(mask, f(:, :, 3));
>> g = cat(3, red, green, blue);
>> subplot(121), imshow(f);
>> subplot(122), imshow(g); 