【数据挖掘案例实践】Loan Status
一、LoanStatus案例介绍
- 数据集变量:
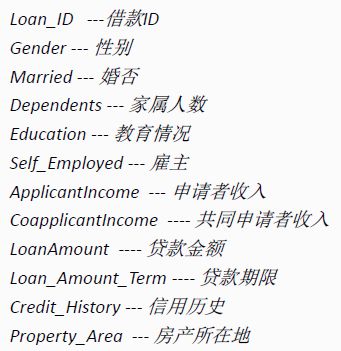
预测变量:
Loan_Status贷款是否成功评价指标:
Cross_validation Score (ROC曲线–AUC得分)- 数据集大小
训练集样本数:614
测试集样本数:367
二、查看数据集
1.导入Python数据挖掘库
import pandas as pd
import numpy as np
import matplotlib.pyplot as plt
2.查看数据集
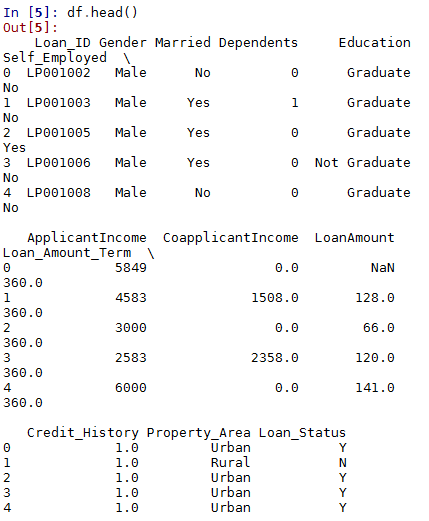
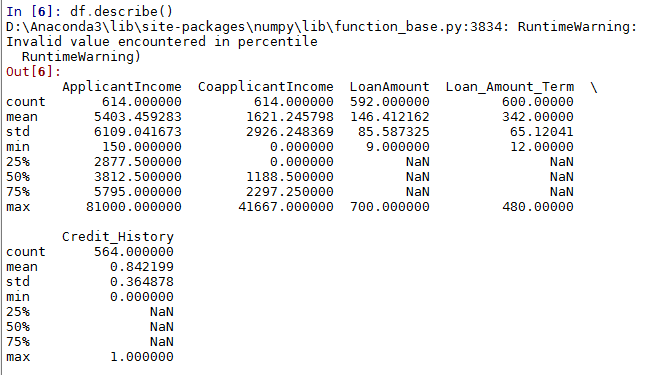
df.head()df.describe()三、变量统计分析
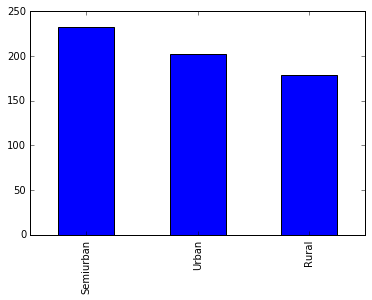
1.查看Property_Area变量
 temp1 = df['Property_Area'].value_counts()
print(temp1)temp1.plot(kind='bar')2.查看ApplicantIncome字段(连续变量)
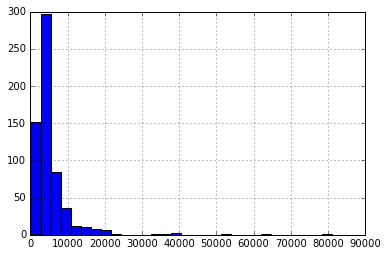
# 绘制ApplicantIncome的直方图
df['ApplicantIncome'].hist(bins=30)
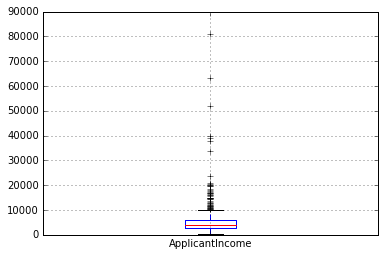
#查看ApplicantIncome 箱线图
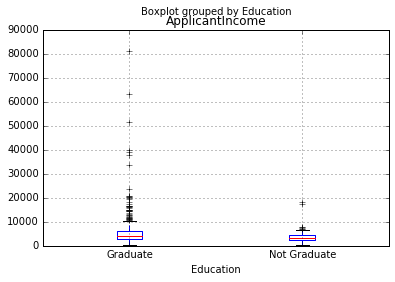
df.boxplot(column='ApplicantIncome')#查看不同教育水平的收入情况
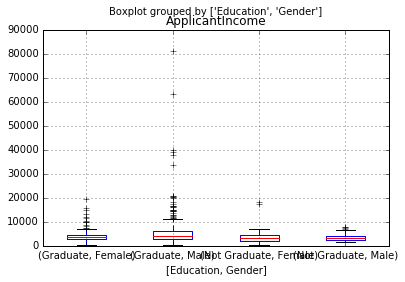
df.boxplot(column='ApplicantIncome',by='Education')#查看不同教育水平及性别的收入情况
df.boxplot(column='ApplicantIncome',by=['Education','Gender'])3. 查看LoanAmount字段(连续变量)
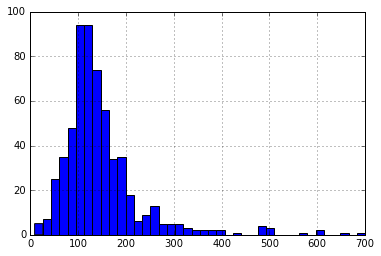
#绘制LoanAmount直方图
df['LoanAmount'].hist(bins=40)
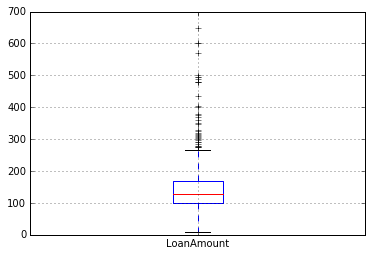
#绘制箱线图
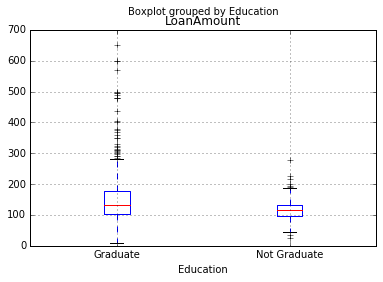
df.boxplot(column='LoanAmount')#查看不同教育水平的人的借款金额箱线图
df.boxplot(column='LoanAmount',by='Education')#看不同性别的人的借款情况
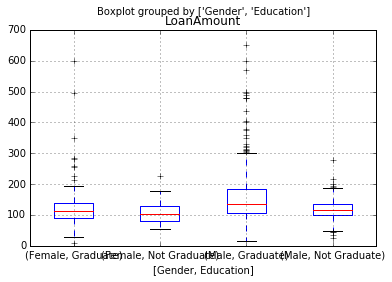
df.boxplot(column='LoanAmount',by='Gender')#不同教育水平&不同性别
df.boxplot(column='LoanAmount',by=['Gender','Education'])4.基于信用情况获得贷款的可能性(Credit_History)
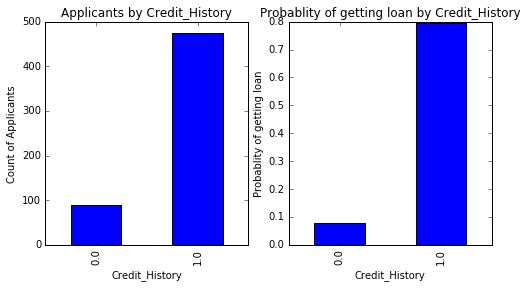
temp1 = df['Credit_History'].value_counts(ascending=True)temp2=df.pivot_table(values='Loan_Status',index=['Credit_History'],
aggfunc=lambda x:x.map({'Y':1,'N':0}).mean())import matplotlib.pyplot as plt
fig=plt.figure(figsize=(8,4))
ax1=fig.add_subplot(121)
ax1.set_xlabel('Credit_History')
ax1.set_ylabel('Count of Applicants')
ax1.set_title("Applicants by Credit_History")
temp1.plot(kind='bar')
ax2=fig.add_subplot(122)
ax2.set_xlabel('Credit_History')
ax2.set_ylabel('Probability of getting loan')
ax2.set_title("Probability of getting loan by Credit_History")
temp2.plot(kind='bar')temp3=pd.crosstab(df['Credit_History'],df['Loan_Status'])
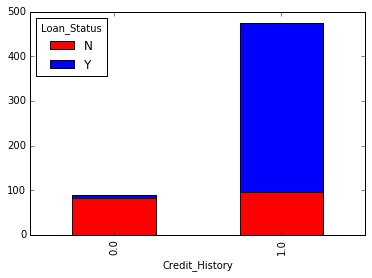
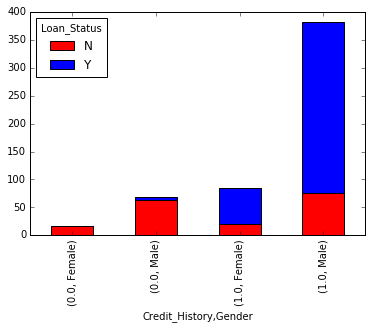
temp3.plot(kind='bar',stacked=True,color=['red','blue'],grid=False)temp4=pd.crosstab([df['Credit_History'],df['Gender']],df['Loan_Status'])
temp4.plot(kind='bar',stacked=True,color=['red','blue'],grid=False)由图可知,历史信用会对贷款结果产生较大的影响
5. 基于婚姻情况获得贷款的可能性
temp4=df['Married'].value_counts(ascending=True)temp5=df.pivot_table(values='Loan_Status',index=['Married'],
aggfunc=lambda x:x.map({'Y':1,'N':0}).mean())四、数据预处理
- 在一些变量中存在缺失值,基于丢失的值的数量估计这些缺失值,并评估变量的重要性
- applicantIncome和LoanAmount存在极值,应适当处理
- 处理非数值领域Gender,Property_Area,Married,Education,Dependents
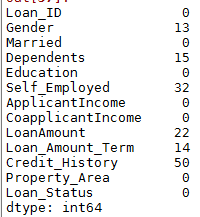
1.查看所有变量中的缺失值个数
df.apply(lambda x:sum(x.isnull()),axis=0)2.填补Self_Employed的缺失值
df['Self_Employed'].value_counts()
df['Self_Employed'].fillna('No',inplace=True)
3.处理Credit_History的缺失值
df['Credit_History'].value_counts()
df['Credit_History'].fillna(1,inplace=True)4.处理Loan_Amount_Term的缺失值
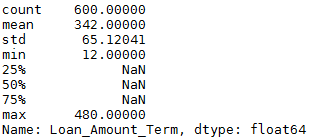
df['Loan_Amount_Term'].describe()
df['Loan_Amount_Term'].fillna(df['Loan_Amount_Term'].notnull().mean(),inplace=True)
5.创建数据透视表,提供我们所有Education和Self_employed变量的唯一值分组的中位数
table=df.pivot_table(values='LoanAmount',index='Self_Employed',columns='Education',aggfunc=np.median)
def fage(x):
    return table.loc[x['Self_Employed'],x['Education']]
#Replace missing values
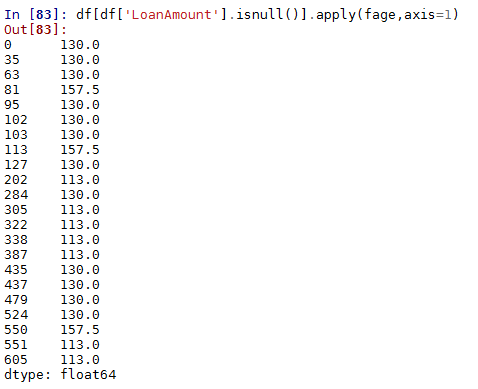
df['LoanAmount'].fillna(df[df['LoanAmount'].isnull()].apply(fage,axis=1),inplace=True)
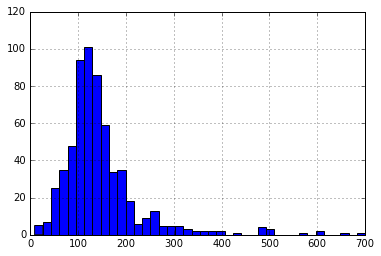
df['LoanAmount'].hist(bins=40)
6.applicantIncome 将申请者和共同申请者两者的收入结合起来作为总收入,并采取相同的对数变换
df['TotalIncome']=df['ApplicantIncome']+df['CoapplicantIncome']
df['TotalIncome_log']=np.log(df['TotalIncome'])
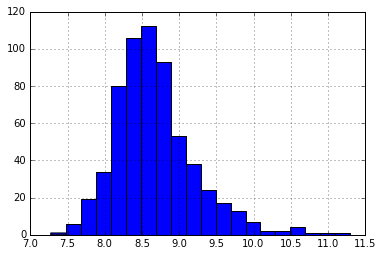
df['TotalIncome_log'].hist(bins=20)
7.哑变量处理
1)处理Gender缺失值
df['Gender'].fillna('Male',inplace=True)