使用MATLAB分析处理csv数据
文章目录
- MATLAB加载csv文件的4种方法
- 用MATLAB对csv数据进行滤波插值制表
- 1 MATLAB加载csv文件,合并数据
- 2 MATLAB滤波和插值
- 3 MATLAB绘制图表
- 4 附录——MATLAB完整代码
MATLAB加载csv文件的4种方法
1 使用csvread函数
csvread()函数有三种使用方法:
 M = csvread('filename')
 M = csvread('filename', row, col)
 M = csvread('filename', row, col, range)
第一种方法中,直接输入文件名,将数据读到矩阵M中。这里要求csv文件中只能包含数字。
第二种方法中,除了文件名,还指定了开始读取位置的行号(row)和列号(col)。
**这里,行号、列号以0开始计数。**也就是说,row=0, col=0表示从文件中第一个数开始读。
第三种方法中,range限定了读取的范围。range = [R1 C1 R2 C2],这里(R1,C1)是读取区域的左上角,(R2,C2)是读取区域的右下角。在使用这种方法时,要求row, col等于range中的前两项。
注意:csv文件中的空项,读到矩阵中时,会初始化为0.
2 使用importdata函数
importdata('myfile.cvs')
前提条件是,都是数据格式
3 使用load函数
B = load('data.csv')
前提条件是,都是数据格式
4 直接拖到Matlab的工作区
如果文件中全部都是数据的话,可以直接将数据拖动到Matlab的工作区内。
在保证所有数据都被选中的情况下,在工具栏的“导入的数据”中选择要导入数据的类型,如果全部为数据,则可以导出为列矢量或者数值矩阵。
参考:MATLAB读取cvs文件的几种方法
用MATLAB对csv数据进行滤波插值制表
1 MATLAB加载csv文件,合并数据
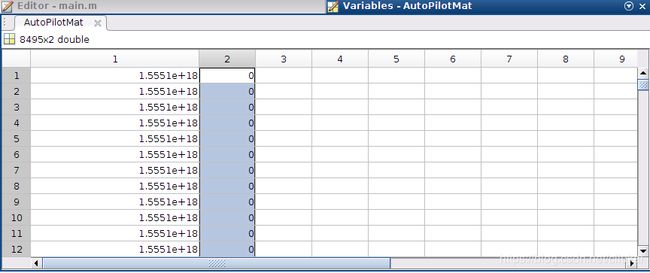
由于csv文件中含有字符串信息,所以采取第一种方法,注意,第一个元素的位置是(0,0)!在MATLAB中输入:
AutoPilotMat = csvread('auto_pilot_enabled__info.csv',1,0);
得到csv中的数据矩阵
依次读取所有数据,并整合到一个矩阵中
AutoPilotMat = csvread('auto_pilot_enabled__info.csv',1,0);
FollowExpectMat = csvread('follow_expect_value_data.csv',1,0);
FollowRealMat = csvread('follow_real_value_data.csv',1,0);
FollowMatRaw = [AutoPilotMat(:,:),FollowExpectMat(:,2),FollowRealMat(:,2)];
2 MATLAB滤波和插值
然后提取属于自动驾驶部分的有效数据,进行滤波(除去200米的数据),除去之后用左右两边的数据来进行线性插值,要注意查找左右两边数据的时候,不要超出边界,查找边界的处理逻辑为:
if (200 == M(i,2))
        % search left side to find valid value
        left = i;
        leftEdgeFlag = 0;
        while( M(left,2) == 200 )
            % if go to the edge, set leftEdgeFlag, then break
            if (1 == left)
                leftEdgeFlag = 1;
                break;
            else
                left = left-1;
            end
        end
        leftValidValue = M(left,2);
end
线性插值的逻辑为:
 distanceLeft = i-left;
 distanceRight = right-i;
 distanceTotal = right-left;
 weightCoefficient = [distanceLeft/distanceTotal,distanceRight/distanceTotal];
 estimateValue = [leftValidValue,rightValidValue]*weightCoefficient';
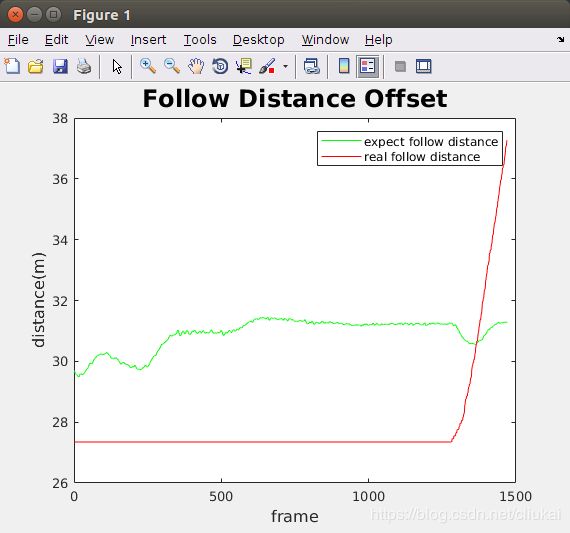
3 MATLAB绘制图表
最后画图,添加说明信息:
% start to figure
figure;
% plot expected follow distance with green lines
plot(M(:,1),'g');
hold on;
% plot real follow distance with red lines
plot(M(:,2),'r');
% add label, title and legends
xlabel('frame','Fontsize',12);
ylabel('distance(m)','Fontsize',12);
title('Follow Distance Offset','Fontsize',18)
legend('expect follow distance','real follow distance')
得到:
4 附录——MATLAB完整代码
完整MATLAB代码:
% function:     1, parse the csv files, reorgnize csv files
%               2, filter data and renew the error value
%               3, plot figure to analysis expected follow distance vs
%                  real follow distance
% contributor:  liukai
% version:      v1.0
% last modify time:     2019.05.22.15.04

clear all;
close all;
clc;

AutoPilotMat = csvread('auto_pilot_enabled__info.csv',1,0);
FollowExpectMat = csvread('follow_expect_value_data.csv',1,0);
FollowRealMat = csvread('follow_real_value_data.csv',1,0);

% merge all these data
FollowMatRaw = [AutoPilotMat(:,:),FollowExpectMat(:,2),FollowRealMat(:,2)];
% auto pilot is on from row 7026
% extract auto pilot data, first column = follow_expect, secend column =
% follow_real
AutoPilotFollowMat = FollowMatRaw(7026:8495,3:4);
% filt data which is 200, use average data to replace it
M = AutoPilotFollowMat;
for i = 1:size(M,1)
    if (200 == M(i,2))
        % search left side to find valid value
        left = i;
        leftEdgeFlag = 0;
        while( M(left,2) == 200 )
            % if go to the edge, set leftEdgeFlag, then break
            if (1 == left)
                leftEdgeFlag = 1;
                break;
            else
                left = left-1;
            end
        end
        leftValidValue = M(left,2);

        % search right side to find valid value
        right = i;
        while( M(right,2) == 200 )
            % if go to the edge, set rightEdgeFlag, then break
            if ( size(M,1) == right)
                rightEdgeFlag = 1;
                break;
            else
                right = right+1;
            end
        end
        rightValidValue = M(right,2);
        % estimate real value, linear addition
        distanceLeft = i-left;
        distanceRight = right-i;
        distanceTotal = right-left;
        weightCoefficient = [distanceLeft/distanceTotal,distanceRight/distanceTotal];
        estimateValue = [leftValidValue,rightValidValue]*weightCoefficient';
        % renew 200 with estimateValue
        M(i,2) = estimateValue;
    end
end
% filteredAutoPilotFollowMat = M;

% start to figure
figure;
% plot expected follow distance with green lines
plot(M(:,1),'g');
hold on;
% plot real follow distance with red lines
plot(M(:,2),'r');
% add label, title and legends
xlabel('frame','Fontsize',12);
ylabel('distance(m)','Fontsize',12);
title('Follow Distance Offset','Fontsize',18)
legend('expect follow distance','real follow distance')