官方下载地址:http://www.qcustomplot.com/index.php/download
下载稳定发布版本,推荐下载第一个链接,里面有很多官方给的例子可以参考。
下载之后将文件解压到任意一个文件夹中,最好不要有中文路径。
首先,打开QtCreator,新建一个窗体工程;直接将解压得到的文件夹里面的头文件qcustomplot.h和源文件qcustomplot.cpp复制粘贴到工程文件夹下。
接着,右键点击工程名,选择添加已有文件,将头文件qcustomplot.h和源文件qcustomplot.cpp都添加到工程中来。
随后,在工程的pro文件的第9行末尾加入代 printsupport,如下图
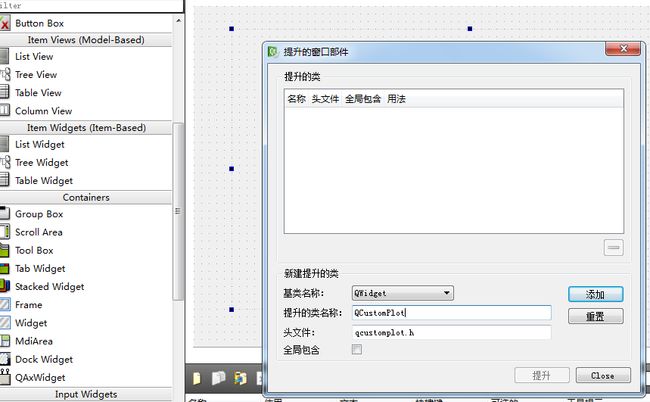
最后,打开界面文件,进入图形化设计界面,向主窗口中添加一个widget区域,对着所添加的widget区域点击右键,选择“提升为”按钮;在提升类名称栏输入“QCustomPlot”,点击添加。
现在我们运行一下程序,就会出现一个简单的坐标系了。
恭喜你,QCustomPlot的基本配置就做好了。
二、第一个例子
首先解释一下原理:
我们可以理解为QCustomPlot就是一个绘图板的类,它继承于Widget,界面中的Widget类提升为QCustomPlot才能够绘图,或者直接新建一个QCustomPlot对象进行绘图。
QCustomPlot中的每一个曲线是一个Graph对象,凡是跟显示数据有关的我们就对Graph进行操作或调用Graph对象提供的方法。
每个QCustomPlot对象都包含四个坐标轴,其中xAxis和yAxis就是我们上图看到的x和y坐标轴,还有两个坐标轴xAxis1和yAxis1为上方和右方的x、y坐标,默认隐藏,可以通过程序设计显示。所有跟绘图背景、坐标轴、标签等有关的操作都直接调用QCustomPlot类函数进行。
具体绘图执行步骤:
首先我们将上面提升为QCustomPlot类的容器界面的对象重命名为qCustomPlot。
此时,我们只需要在主类Widget构造函数中加入如下代码,即可绘制一个标准标准的y=x^3的曲线,代码含义代码中有注释。
1
#include "mainwindow.h"
#include "ui_mainwindow.h"
#include "qcustomplot.h"
MainWindow::MainWindow(QWidget *parent) :
QMainWindow(parent),
ui(new Ui::MainWindow)
{
ui->setupUi(this);
QCPGraph *pGraph=ui->customPlot->addGraph();
// 可变数组存放绘图的坐标的数据,分别存放x和y坐标的数据,101为数据长度
QVector<double> x(101), y(101);
// 添加数据,这里演示y = x^3,为了正负对称,x从-10到+10
for (int i = 0; i < 101; ++i)
{
x[i] = i/5 - 10;
y[i] = qPow(x[i], 3); // x的y次方;
}
// 添加数据
pGraph->setData(x, y);
// 设置坐标轴名称
ui->customPlot->xAxis->setLabel("x");
ui->customPlot->yAxis->setLabel("y");
// 设置背景色
ui->customPlot->setBackground(QColor(50, 50, 50));
pGraph->setPen(QPen(QColor(32, 178, 170)));
// 设置x/y轴文本色、轴线色、字体等
ui->customPlot->xAxis->setTickLabelColor(Qt::white);
ui->customPlot->xAxis->setLabelColor(QColor(0, 160, 230));
ui->customPlot->xAxis->setBasePen(QPen(QColor(32, 178, 170)));
ui->customPlot->xAxis->setTickPen(QPen(QColor(128, 0, 255)));
ui->customPlot->xAxis->setSubTickPen(QColor(255, 165, 0));
QFont xFont = ui->customPlot->xAxis->labelFont();
xFont.setPixelSize(20);
ui->customPlot->xAxis->setLabelFont(xFont);
ui->customPlot->yAxis->setTickLabelColor(Qt::white);
ui->customPlot->yAxis->setLabelColor(QColor(0, 160, 230));
ui->customPlot->yAxis->setBasePen(QPen(QColor(32, 178, 170)));
ui->customPlot->yAxis->setTickPen(QPen(QColor(128, 0, 255)));
ui->customPlot->yAxis->setSubTickPen(QColor(255, 165, 0));
QFont yFont = ui->customPlot->yAxis->labelFont();
yFont.setPixelSize(20);
ui->customPlot->yAxis->setLabelFont(yFont);
// 设置坐标轴显示范围,否则只能看到默认范围
ui->customPlot->xAxis->setRange(-11, 11);
ui->customPlot->yAxis->setRange(-1100, 1100);
}
这样我们就简单的绘制好一个3次方的曲线了
参考资料:
http://www.cnblogs.com/yingjiehit/p/3988701.html
http://blog.csdn.net/liang19890820/article/details/51944511