Use DevTools
Background:
Browser developer tools, available on major web browsers -- Chrome, Safari and Firefox to name a few -- enable web developers to quickly collect vital information on most web applications, including ones that you yourself are building. Because it’s the choice for most professional developers, this article will focus on how to use Google Chrome’s DevTools.
First, we’ll learn how to access the DevTools, then take a look at how to use them to:
-
Debug CSS and HTML to solve layout issues
-
Debug your JavaScript using the console tool
-
See important metadata about your web app
Accessing the DevTools Window:
On Macs, the easiest way to access DevTools is to navigate to a webpage in a Chrome window, press Ctrl + Click (or Right Click if you have an old-fashioned two-button mouse) anywhere inside the document. A menu will pop up next to where you clicked. Select "Inspect Element." This will launch the DevTools window in the bottom third of your screen. It should look something like this:
You’ll see eight tabs: Elements, Network, Sources, Timeline, Profiles, Resources, Audits and Console. This article will just focus on the Elements, Console and Network tabs, but we recommend you research and experiment with all of them.
Debug CSS and HTML to Solve Layout Issues:
When laying the foundation for your own web app, it’s common practice to test your code by opening your HTML file in the browser and checking it out for yourself. Your HTML doesn’t need to be hosted on a server to do this! You can just open a new tab in Chrome and hit Cmd + o (Ctrl + o on Windows) or "File" > "Open" to browse your computer for your HTML file. Once your file is up, see if it’s doing what you expected. If something seems off, open the DevTools by following the instructions above and start investigating.
The "Elements" tab contains a real-time, interactive DOM (short for document object model). The DOM is the data structure that stores all of your HTML. Play around with it! You can change anything in the DOM and see results instantly. The only catch is that once you reload the page, your changes will disappear – so don’t refresh without copying any changes you want to hold on to.
The CSS you wrote will be available in the "Elements" tab as its own scrollable section. You can find this on the right side of the DevTools window under "Styles":
Just like you could with your HTML elements in the DOM, you can change any property or value here and see the results in real-time. Maybe the rule you wrote for image tags is not positioning them the way you expected, or you want to change a background color or font-size. Experiment all you want here until you like what you see. But remember, you have to change the source code – the HTML and CSS files you loaded into the browser from your computer – or the changes you make in DevTools will disappear as soon as you reload the page.
Debug your JavaScript Using the Console Tool:
If you’ve written custom JavaScript or jQuery functions to enhance your web app, you have full access to your code inside DevTools. Access your variables and functions or write new ones and watch them change the behavior of your web page within the DevTools console. If your code has syntax errors, or if files necessary to make your JavaScript run can’t be accessed, you’ll see error messages in that console. The error messages will give you concise descriptions about the nature of the problem.
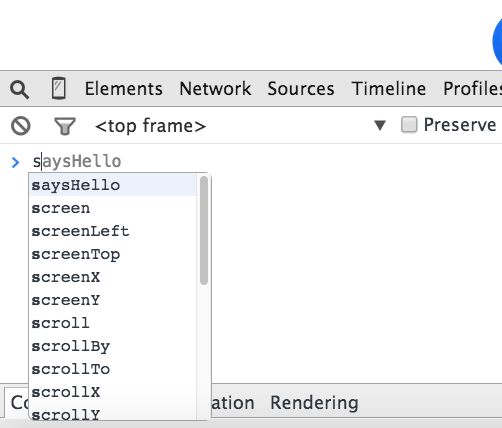
To start using the console, navigate to the rightmost tab, titled "Console." Test that your JavaScript has loaded by starting to type in the name of one of your functions. If you see a pop-up with a list of functions that includes your function’s name, you know that DevTools is reading your JavaScript file. In the example below, DevTools has found my custom function, saysHello().
Remember, the DevTools console is a full JavaScript interpreter. It can run any valid JavaScript expression you type in it. If you’re linked to a library, like jQuery, it has access to all jQuery’s functions, too.
Console Pro Tips:
- While writing JavaScript in the console, you may find that the screen fills up pretty quickly with code and error messages. On Macs, Ctrl + K (Ctrl + L on Windows) clears the console so you can start with a fresh screen. Your previous lines of code are not lost. Use the arrow key to restore cleared lines.
- In the console, the Return (a.k.a, "Enter") key immediately executes your code. So, if you want to write multi-line functions, like the one below, use Ctrl + return (Shift + Enter on Windows) at the end of the line to jump down to a new one.
The DevTools console is excellent for helping you understand what JavaScript can and can’t do, and giving you instant feedback through error messages and real-time changes to your page. DevTools also has the more advanced V8 debugging tool in the "Sources" tab, which is out of the scope of this article. If it piques your interest,you can learn more about it here.
View Metadata About Your Web App with the NetworkTab:
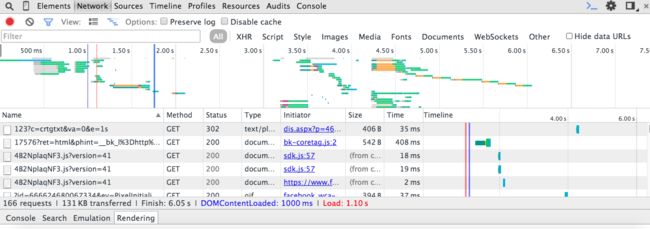
The "Network" tab – the second tab over from the left, next to "Elements" – contains valuable data about network operations, which are communications between your web browser and the server providing you the web page. If the tab is blank when you open it, you may have to click reload to fill in network data.
The Network tab looks complicated at first, but it’s worth getting familiar with.
It’s a lot, right? Don’t be overwhelmed. Just focus on the table in the bottom half of the tab. Specifically, we’re just going to look a few of those headers:
Name: This is the column where you can view the name of every resource, a.k.a, every file, that is needed to create the web page you’re looking at. Scroll through the list and check out the file extensions. Can you figure out what types of files they are? See any .js or .png?
Method: This column might not be listed by default. If you don’t see it, hover your mouse over any header and press Ctrl + Click or Right Click to see a full list of headers. (Please note: this works for Macs only).
Under the Methods column it just says, "GET, GET, GET, GET, GET ..." What does that mean? GET is the most common HTTP method: a request for data. The method literally goes and gets resources from a server and brings them back to your web browser. Other methods you might see in this column are POST or DELETE. The POST method brings new data to the server. You’ll see this one when you hit "submit" to create a new user profile on a web page. DELETE is a method that tells the server to delete information.
Status: Status codes are reports that the server gives to the client (your web browser in this case) about the requested resource. You should see a lot of 200 codes, meaning that the resources for the web page you requested came over "okay" from the server. 404 errors are also particularly important. They’ll be highlighted in red. You can read more about 404 errors and what they mean here.
Type: Here is where you can see what type of file the resource is. Scan the list for.css, .html, .js or file extensions for media files.
Size: This column shows you the file size of a resource in bytes. Which file would you expect to have more bytes: a CSS stylesheet or a video?
Time: This column shows you exactly how long it took each resource to load, from the instant it was requested until the last byte loaded in your browser. If you’re on a new computer and have a strong internet connection, most of the resources you’re looking at will have loaded in a matter of milliseconds. Pretty amazing, right?
Note: This article on Chrome DevTools was meant to serve as a high-level introduction. There is a lotmore to know, and lot more you can do with these tools. Google "Chrome DevTools" to learn more.


