As a programmer or a developer, error handling and bug fixing are what we deal with every day. When a critical error happens, what is a proper way to handle it? Different people may have different ways. Here I will talk about how to terminate an application properly and collect debugging data fully and elegantly in C++ applications on Windows platform. Same methodology should apply to other platforms or other programming languages.
When we talk about error handling, it covers many topics actually, including error code returning and checking among functions, exception throw and capture in code blocks, writing information to a log file, creating dump files, restarting the process, or switching to other active nodes, etc. In this article, I will talk about how to catch errors or exceptions at a global scope in a process, and the correspondent handling, separation of the code doing business logic, as the in place try-catch or __try-__except-__finally with code doing real things are usually distractions, though really needed sometimes. and the handling of it. Once captured, I can write the error and related information to console or a log file, or creating a dump file, or both.
All the test in this article were done on Windows 7 SP1 and Visual Studio 2015 Express with update 3.
1. Windows Error Reporting Service
First, let's start with a simple piece of code, which has an error causing different kinds of results based on system configuration or code. Here is the piece of code, code sample 1:
int main()
{
    int i = 10, j = 0;
    int k = i / j;
    cout << " k is: " << k << endl;
    return 0;
}
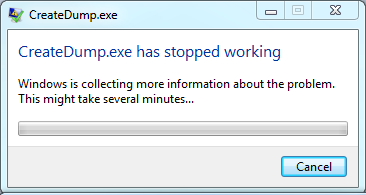
It is simple and obvious. A “division by zero” error or exception is thrown from line 4, to the system as it is not handled within the process yet. When running the program, this is prompted.
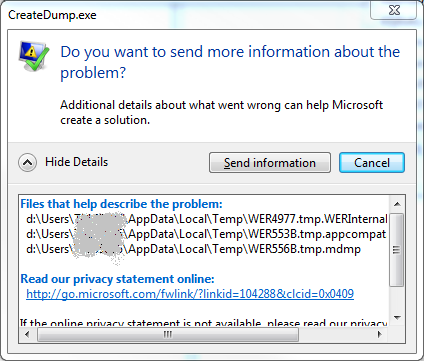
The exception causes the program crash, users are prompted with the above dialogues for a choice to send this information to Microsoft or cancel, which means these files are to be deleted and there are no data or files collected by Windows for developers to investigate.
A tiny dump file and program configuration information files are created by Windows by default in the user temporary directory. You can actually debugging it before you make a choice on the prompted dialogues, or copy the files to other placesfor later debugging.
It is the Windows Error Reporting Service who catches the exception and created these files and prompts the user for a choice. This service is mainly for windows technical analysis and support, to investigate errors/bugs in Windows Libraries and services. In most commercial applications these files are not sent due to possible confidential information leakage, at least they are not sent to Microsoft for every error.
More seriously, WerFault.exe, which is the process name of Windows Error Reporting Service, hangs the process there before the user makes a choice. If your application is a service, or a server application, usually it should be restarted as soon as possible to decrease the down time. So this service is not so attractive. If you search it on the Internet, you will find a lot of discussions and issues about it and most of the suggestions are to disable or remove it.
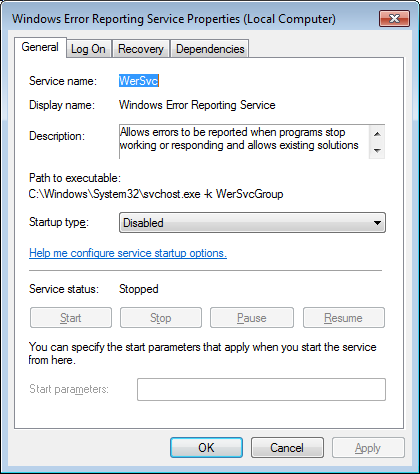
Briefly, to disable this service, go to the services panel and change it.
2. Application Error Message Box
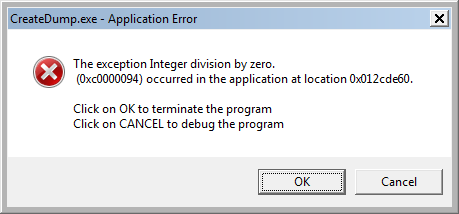
Now you run the our first program again, an application error dialog or message box is prompted, not the ones from WerFault.exe, but another annoying one, which hangs the process also, to indicate application critical error. This is always terrifying to end users or customers, as they have no idea about what the problem is, but the red circle with white cross is pretty alarming. This message is from Windows too, as Windows handles critical application errors at the operating-system level by default.
Just like WerFault.exe prompted dialogues, you don't like this dialog either. How to get rid of it, so the program can restart, or shutdown not so noisily? Windows operating system needs to be informed not to show a message box for critical error messages.
There is a Windows API to set the error mode, which means, when unexpected error happens, how windows operating system should respond. The API is SetErrorMode. You can use this API to disable this dialog.
Here is the code about using SetErrorMode, code sample 2.
int main()
{
   ::SetErrorMode(SEM_FAILCRITICALERRORS | SEM_NOGPFAULTERRORBOX | SEM_NOOPENFILEERRORBOX);
   int i = 10, j = 0;
   int k = i / j;
   cout << " k is: " << k << endl;
   return 0;
}
Now run this program, there is nothing prompted, the process just exits like nothing happened.
Users are not prompted, and the process is terminated and can be restarted now. But this silent error and exit pattern is annoying as you have no clues at all, you don't even know if a problem has happened or not and when, where and why the problem happens.
3. Capture Exceptions Within Your Application
So you need a kind of error and exception processing mechanisms within the program, which can terminate the process in time and collect enough data for developers to investigate. One way is using Windows API SetUnhandledExceptionFilter This API sets a filter function (UnhandledExceptionFilter) to receive and process the exception with an exception pointer, which contains all the information about this error. The simple way is to trace the error and then let the process die peacefully.
Here is the code, code sample 3.
LONG __stdcall DebugExceptionFilter(EXCEPTION_POINTERS* pExPtrs)
{
   cerr << "Exception captured, code: " << std::hex << pExPtrs->ExceptionRecord->ExceptionCode
        << std::dec << endl;
   return 1;
}

int main()
{
   LPTOP_LEVEL_EXCEPTION_FILTER prev1 = SetUnhandledExceptionFilter(DebugExceptionFilter);
   int i = 10, j = 0;
   int k = i / j;
   cout << " k is: " << k << endl;
   cout << "continue processing!" << endl;
   return 0;
}
So this filter function gets the exception pointer and print out the exception code. Returning 1 in this function means to the system that if SetErrorMode is called properly, no applicator error message box is to be displayed. Running this program and you will get this in the console and nothing more.
Exception captured, code: c0000094
From this exception code, you can search MSDN to get the name of the exception and know what exception it is.
This is nice, but not good enough. You know the exception code, but you still need the call stack information, stack data, heap maybe, etc. To do that, using some third-party libraries is an option, but alternatively and less dependently, you can create a dump file in this filter function using Windows API MiniDumpWriteDump.
4. Create a Dump File When Exception Happens
It is not hard to write dump files in your own code, here is the code, code sample 4.
string PrintError()
{
   unsigned long errCode = ::GetLastError();
   std::stringstream ss;
   ss << "error code: " << errCode << endl;
   return ss.str();
}

bool CreateMiniDump(void * exceptionPtrs)
{
   auto now = std::chrono::system_clock::now();
   auto in_time_t = std::chrono::system_clock::to_time_t(now);

   std::stringstream ss;
   ss << std::put_time(std::localtime(&in_time_t), "%Y-%m-%d-%H-%M-%S");
   string file = ss.str() + ".dmp";

   HANDLE hFile = ::CreateFileA(file.c_str(), GENERIC_WRITE, FILE_SHARE_WRITE, NULL, CREATE_ALWAYS, FILE_ATTRIBUTE_NORMAL, NULL);
   if (hFile == INVALID_HANDLE_VALUE)
   {
      cerr << "CreateFileA failed, " << PrintError() << endl;
   }

   MINIDUMP_EXCEPTION_INFORMATION mei;
   mei.ThreadId = GetCurrentThreadId();
   mei.ExceptionPointers = (PEXCEPTION_POINTERS)exceptionPtrs;
   mei.ClientPointers = FALSE;

   cout << "Creating MiniDump in file: " << file << ", exception pointer: " << exceptionPtrs << endl;
   if (!MiniDumpWriteDump(GetCurrentProcess(), GetCurrentProcessId(), hFile, MiniDumpWithFullMemory, exceptionPtrs ? &mei : NULL, NULL, NULL))
   {
      cerr << "MiniDumpWriteDump failed, " << PrintError() << endl;
   }

   ::CloseHandle(hFile);

   return true;
}

LONG __stdcall DebugExceptionFilter(EXCEPTION_POINTERS* pExPtrs)
{
   cerr << "Exception captured, code: " << std::hex << pExPtrs->ExceptionRecord->ExceptionCode
      << std::dec << endl;

   CreateMiniDump(pExPtrs);

   return 0;
}

int main()
{
   ::SetErrorMode(SEM_FAILCRITICALERRORS | SEM_NOGPFAULTERRORBOX | SEM_NOOPENFILEERRORBOX);
   LPTOP_LEVEL_EXCEPTION_FILTER prev1 = SetUnhandledExceptionFilter(DebugExceptionFilter);
   int i = 10, j = 0;
   int k = i / j;
   cout << " k is: " << k << endl;
   return 0;
}
In this example, when exception happens, the filter function prints the exception code, and then creates a dump file for the process. The dump file has all the process data at that time when problem happens, call stack, stack data, heap data, system resources, etc. It is much easier for developers to investigate later, and this way the program terminates peacefully also and can just be restarted and the service keeps running. Everybody wins!
Exception captured, code: c0000094
Creating MiniDump in file :2017-02-19-13-56-59.dmp, exception pointer: 0042F34C
In the current directory of the process, a dump file is created. The file name is the time stamp, of course, you can customize it to anything you like, maybe with process name, process id, user name, machine name, etc, especially with a time stamp is helpful for developers to know the time of the occurrence of the problem easily.
5. Capture C++ Typed Exception
In all above examples, the exception is Windows/C/Structured exception. What about C++/Typed exceptions? Does this filter function cover C++ exceptions also?
Let's try it. Here is the code with a C++ class simply throwing an exception, code sample 5.
class Foo
{
public:
   void ThrowIt()
   {
      throw std::runtime_error("just a test");
   }
};

int main()
{
   ::SetErrorMode(SEM_FAILCRITICALERRORS | SEM_NOGPFAULTERRORBOX | SEM_NOOPENFILEERRORBOX);
   LPTOP_LEVEL_EXCEPTION_FILTER prev1 = SetUnhandledExceptionFilter(DebugExceptionFilter);
   Foo foo;
   foo.ThrowIt();
   return 0;
}
Running it you will get this in the output. The exception is captured by the filter function and a dump file is created. And process has died properly, same as the programs for Windows exceptions.
Exception captured, code: e06d7363
Creating MiniDump in file: 2017-02-19-14-24-17.dmp, exception pointer: 0022F134
Open the dump file in a Visual Studio to debug it, the call stack is as below.
So all the information are in the dump file and they are very help for the investigation. Once developers get this dump file, they are much closer to the fix of the problem.
6. Capture Exception in a thread
Now all we have tested is for a process with only 1 thread. How about multiple threads? Does this filter function cover other thread than the main thread?
Let's change the code to add a thread. Here is the code, code sample 6.
void foo()
{
   cout << "thread is started!" << endl;

   int i = 10, j = 0;
   int k = i / j;
   cout << " k is: " << k << endl;
}

int main()
{
   ::SetErrorMode(SEM_FAILCRITICALERRORS | SEM_NOGPFAULTERRORBOX | SEM_NOOPENFILEERRORBOX);
   LPTOP_LEVEL_EXCEPTION_FILTER prev1 = ::SetUnhandledExceptionFilter(DebugExceptionFilter);

   std::thread first(foo);
   first.join();

   return 0;
}
Using C++ thread library, a simple thread is added, simply does a 'division-by-zero' operation. Running the program, the exception code is printed and a dump file is created, which means, the filter function works perfects in a multiple thread application.
thread is started!
Exception captured, code: c0000094
Creating MiniDump in file: 2017-02-19-16-34-33.dmp, exception pointer: 009AF114


