第11章 中级绘图
本章内容:
- 二元变量和多元变量关系的可视化
- 绘制散点图和折线图
- 理解相关图
- 学习马赛克图和关联图
主要关注用于展示双变量间关系(二元关系)和多变量间关系(多元关系)的绘图方法。
包括大数据展示时数据点重复问题的解决,可视化多种数据后如何分析数据间关系,理解数据结构。
11.1 散点图
散点图:描述两个连续变量间的关系。
-
本节内容:
- 散点图描述二元变量关系(x对y)
- 添加额外信息增强图形表达功能
- 多个散点图组合为散点图矩阵,同时展示多个二元变量关系
- 数据点重叠的解决方案
- 添加第三个连续变量二维图形扩展至三维
-
技术基础
- R中创建散点图的基础函数
plot(x,y),其中,x和y是数值型向量,代表图形中的(x,y)点。 - car包中
scatterplot()函数,增强散点图。可以添加拟合曲线、边界箱线图和置信椭圆,还可按子集绘图和交互式识别点。
- R中创建散点图的基础函数
plot()基本散点图
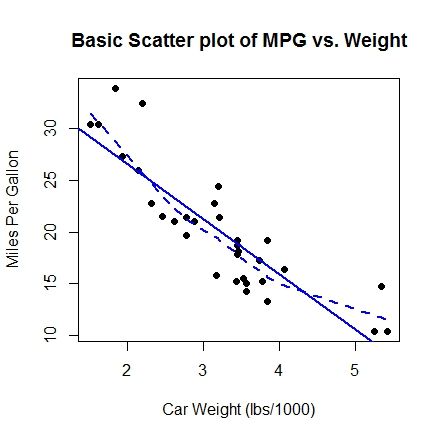
代码清单11-1 添加了最佳拟合曲线的散点图
> attach(mtcars)
> plot(wt, mpg,
+      main = "Basic Scatter plot of MPG vs. Weight",
+      xlab = "Car Weight (lbs/1000)",
+      ylab = "Miles Per Gallon", pch=19)
> abline(lm(mpg ~ wt), col="blue", lwd=2, lty=1) #线性回归拟合
> lines(lowess(wt, mpg), col="blue", lwd=2, lty=2) #平滑曲线拟合
abline()函数添加最佳拟合的线性直线,而
lowess()函数添加平滑曲线,该平滑曲线拟合
基于局部加权多项式回归的非参数方法。算法细节参见Cleveland(1981)。
R中有两个平滑曲线拟合函数:
lowess()和
loess()。
loess()是基于
lowess()表达式版本的更新和更强大的拟合函数。这两个函数的
默认值不同。
- scatterplot()增强散点图
> library(car)
> scatterplot( mpg ~ wt | cyl, data=mtcars, lwd=2, #按cyl分类绘制mpg与wt的散点图
+              main = "Scatter Plot of MPG vs. Weight by # Cylinders",
+              xlab = "Weight of Car (lbs/1000)",
+              ylab = "Miles Per Gallon",
+              legend.plot = TRUE, #左上角添加图例
+              id.method = "identify", #交互式识别散点
+              labels = row.names(mtcars), #散点标签为数据框中对应的行名
+              boxplots="xy" #添加x、y轴的箱线图
+ )
[1] "Merc 240D"      "Fiat 128"       "Toyota Corolla"
>
- 拓展
散点图一次只能对两个定量变量的关系进行可视化。如要比较多个变量的二元关系。要使用散点图矩阵。
11.1.1 散点图矩阵
技术基础
R中创建散点图矩阵函数:
- pairs()函数
- scatterplotMatrix()函数 via car包
- cpairs()函数 via gclus包
pairs()函数基础散点图矩阵
> pairs( ~ mpg + disp + drat + wt, data=mtcars,
+        main="Basic Scatter Plot Matrix")
选项upper.panel = NULL将只生成下三角图形。
scatterplotMatrix()散点图矩阵
car包中的scatterplotMatrix()函数,有以下操作项:
- 以某个因子为条件绘制散点图矩阵;
- 包含线性和平滑拟合曲线;
- 在主对角线防止箱线图、密度图或者直方图;
- 在各单元格的边界添加轴须图。
案例一:
> library(car)
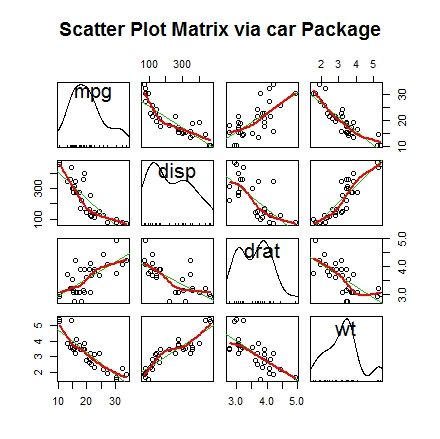
> scatterplotMatrix(~ mpg + disp + drat + wt, data=mtcars,
+                   spread=FALSE, smoother.args=list(lty=2),
+                   #spread = FALSE 不添加展示分散度和对称信息的直线
+                   #lty.smooth=2平滑(loess)拟合曲线使用虚线
+                   #标题:通过car包实现的散点图矩阵
+                   main="Scatter Plot Matrix via car Package"
)
线性和平滑拟合曲线默认被添加,主对角线添加核密度曲线和轴须图。
案例二:
library(car)
scatterplotMatrix(~ mpg + disp + drat + wt | cyl, data=mtcars, #按cyl分类绘制
                  spread=FALSE, diagonal = "histogram",
                  #不显示分散度和对称信息的直线,对角线=直方图
                  smoother.args=list(lty=2),
                  #曲线拟合采用虚线
                  main="Scatter Plot Matrix via car Package")
主对角线的核密度曲线改为直方图,按照汽缸车cyl分类绘制。
默认回归直线拟合整个样本,包含选项by.groups = TRUE将依照各子集分别生成拟合曲线。(针对cyl分组后结果分别拟合)
cpairs()函数生成散点图矩阵
cpairs()函数基于gclus包。
#gclus包中cpairs()
#11-2 gclus包生成散点图矩阵
cor(mtcars[c("mpg", "wt", "disp", "drat")])
library(gclus)
mydata <- mtcars[c(1, 3, 5, 6)]
mydata.corr <- abs(cor(mydata))
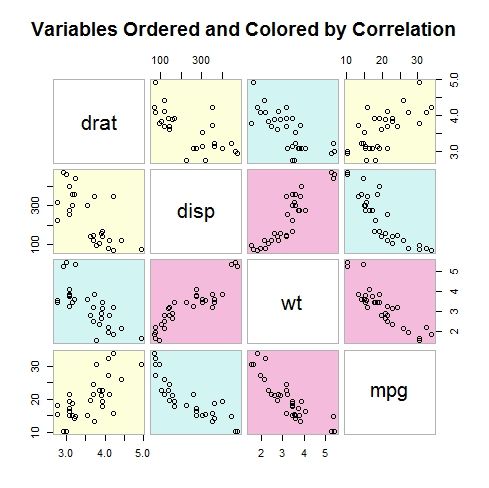
mycolors <- dmat.color(mydata.corr) #damt.color生成对应颜色矩阵
myorder <- order.single(mydata.corr) #order.single()函数重排对象,相似颜色对象更近
cpairs(mydata, myorder, panel.colors=mycolors, gap=0.5, #panel面板, gap单元格间距增大
       main="Variables Ordered and Colored by Correlation"
) #使用order.single对对象重排后,相关性强的靠近对角线,变量较多时,容易判别。
11.1.2 高密度散点图
数据点重叠严重,散点图不便于观察。
set.seed(1234) #随机数种子
n <- 10000
c1 <- matrix(rnorm(n, mean=0, sd=.5), ncol=2) #10000个随机书,2列排列
c2 <- matrix(rnorm(n, mean=3, sd=2), ncol=2)  #10000个随机书,2列排列
mydata <- rbind(c1, c2) #按照行合并,纵向连接
mydata <- as.data.frame(mydata) #转化为数据框
names(mydata) <- c("x", "y") #变量命名
with(mydata,  #直接展示数据
 plot(x, y, pch=19, main="Scatter Plot with 10000 Observations")) #pch符号类型
数据重叠,x、y关系难以辨识。
解决方案:封箱、颜色和透明度指明任意点上重叠点的数目。
- smoothScatter()函数核密度颜色散点图
smoothScatter()核密度估计生成颜色密度表示散点图。
with(mydata,
 smoothScatter(x, y, main="ScatterPlot Colored by Smoothed Densities"))
- hexbin()函数 via hexbin包
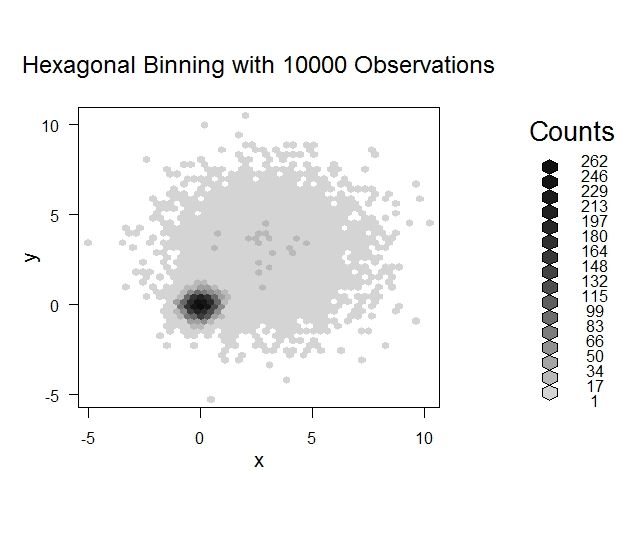
hexbin()函数将二元变量的封箱放到六边形单元格中。
library(hexbin)
with(mydata, {
     bin <- hexbin(x, y, xbins=50)
     plot(bin, main="Hexagonal Binning with 10000 Observations")
     })
- iplot()函数 颜色展示点的密度 via IDpmisc包
library(IDPmisc)
with(mydata,
     iplot(x, y, main="Image Scatter Plot with Color Indicating Density"))
11.1.3 三维散点图
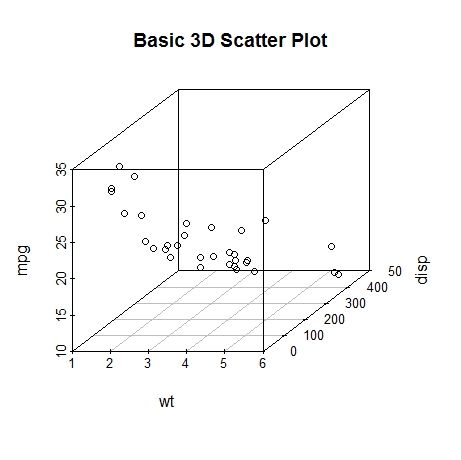
三个定量变量的交互关系可视化,使用scatterplot3d包中的scatterplot3d()函数。格式如下:
scatterplot3d(x, y, z)
x、y和z分别绘制与水平轴、垂直轴和透视轴。
library(scatterplot3d)
attach(mtcars)
scatterplot3d(wt, disp, mpg, main="Basic 3D Scatter Plot")
scatterplot3d()函数提供了多种选项,包括设置图形符号、轴、颜色、线条、网格线、突出显示和角度等功能。例如:
#scatterplot3d增强
library(scatterplot3d)
attach(mtcars)
scatterplot3d(wt, disp, mpg,
              pch=16, #符号类型
              highlight.3d=TRUE, #
              type="h",
              main="3D Scatter Plot with Vertical Lines")
添加了连接点与水平面的垂直线,增强纵深感。
添加回归面:
#scatterplot3d添加回归面
library(scatterplot3d)
attach(mtcars)
s3d <- scatterplot3d(wt, disp, mpg,
                     pch=16,
                     highlight.3d=TRUE,
                     type="h",
                     main="3D Scatter Plot with Vertical Lines and Regression Plane")
fit <- lm(mpg ~ wt + disp) #回归拟合mpg与wt+disp
利用多元回归方程,添加回归平面。平面代表预测值,图中点为实际值。平面到点的垂直距离表示残差值。
- 旋转散点图
plot3d()函数 via rgl包,可创建交互的三维散点图。
library(rgl)
attach(mtcars)
plot3d(wt, disp, mpg, col="red", size=5)
scatter3d()函数 via Rcmdr包
library(Rcmdr)
attach(mtcars)
scatter3d(wt, disp, mpg)
scatter3d()函数可包含各种回归面,比如线性、二次、平滑和附加等类型。图形默认添加线性平面。另外,函数中还有可用于交互式识别点的选项。
11.1.4 气泡图
先创建二维散点图,然后用点的大小来表示第三个变量的值。这便是气泡图(bubble plot)。
symbols()函数,可以创建气泡图。函数可在指定的(x,y)坐标上绘制圆圈图、方型图、星型图、温度计图和箱线图。以绘制圆圈图为例:
symbols(x, y, circle = radius)
#symbols()
attach(mtcars)
r <- sqrt(disp/pi)
symbols(wt, mpg, circle=r, inches=0.30, #圆圈大小
        fg="white", bg="lightblue",
        main="Bubble Plot with point size proportional to displacement",
        ylab="Miles Per Gallon",
        xlab="Weight of Car (lbs/1000)")
text(wt, mpg, rownames(mtcars), cex=0.6) #添加气泡名
detach(mtcars)
专业统计中避免使用气泡图,因为和饼图一样,人们对于体积/面积的判断更困难。
但气泡图在商业中比较受欢迎。
11.2 折线图
将散点图上的点从左至右连接起来,就得到折线图。折线图是刻画变动的优秀工具。
代码清单11-3 创建散点图和折线图
opar <- par(no.readonly=TRUE) #增加新的作图设置
par(mfrow=c(1, 2)) #1行2列
t1 <- subset(Orange, Tree==1) #在Orange数据集中选择Tree为1的数据
plot(t1 $ age, t1 $ circumference,
     xlab="Age (days)",
     ylab="Circumference (mm)",
     main="Orange Tree 1 Growth")
plot(t1 $ age, t1 $ circumference,
     xlab="Age (days)",
     ylab="Circumference (mm)",
     main="ORange Tree 1 Growth",
     type="b") #type = "b" 线连接点
par(opar)
参数主要区别仅为type="b"。
折线图通过下列两个函数之一创建:
plot(x, y, type= )
lines(x, y, type= )
type="p"典型散点图,type=“b”常见折线图,type=“s”先横后竖,type=“S”反之。
plot()和lines()不同,plot()被调用即创建一副图形。lines()在已有图形上添加信息。并不能生成图形。
代码清单11-4 展示五五种橘树随时间推移的生长状况的折线图
Orange$Tree <- as.numeric(Orange$Tree) #转换为数值型
ntrees <- max(Orange$Tree)

xrange <- range(Orange$age)
yrange <- range(Orange$circumference)

plot(xrange, yrange,
     type="n", #仅绘制图形外轮廓不加点、线
     xlab="Age (days)",
     ylab="Circumference (mm)"
)

colors <- rainbow(ntrees) #生成颜色序列
linetype <- c(1:ntrees) #线形
plotchar <- seq(18, 18+ntrees, 1) #点类型

for (i in 1:ntrees) {
    tree <- subset(Orange, Tree == i)
    lines(tree$age, tree$circumference,
          type="b",
          lwd=2,
          lty=linetype[i],
          col=colors[i],
          pch=plotchar[i]
     )
}

title("Tree Growth", "example of line plot")

legend(xrange[1], yrange[2]#添加图例,图例位置
       1:ntrees,
       cex=0.8,
       col=colors,
       pch=plotchar,
       lty=linetype,
       title="Tree"
)
11.3 相关图
corrgram()函数 via corrgram包。展示相关系数矩阵。
options(digits=2) #显示小数点后2位
cor(mtcars)
library(corrgram)
corrgram(mtcars, order=TRUE, lower.panel=panel.shade,
         upper.panel=panel.pie, text.panel=panel.txt,
         main="Correlogram of mtcars intercorrelations")
读图:默认地,蓝色和从左下指向右上的斜杠表示单元格中的两个变量呈正相关。反过来,红色和左上至右下的斜杠表示单元格中的两个变量负相关。色彩越深,饱和度越高,变量相关性越强。相关系数接近与0的单元格基本无色。本图为将有相关模式的变量聚在一起,对矩阵的行和列使用主成份法进行重排。
上三角单元用饼图展示了相同的信息,颜色功能同上,相关性大小由饼图块大小展示,正相关自12点钟顺时针填充,负相关逆时针填充。
corrgram()函数使用格式:
corrgram(x, order= , panel= , text.panel= , diag.panel= )
其中,x是观测的数据框,order=TRUE使用主成份分析对变量重新排序,使得二元变量的关系更明显。
选项panel设定非对角线面板使用的元素类型。lower.panel和upper.panel分别设置主对角线下方和上方的元素类型。text.panel和diag.panel控制主对角线元素类型。
library(corrgram)
#下三角使用平滑拟合曲线和置信椭圆,上三角使用散点图
corrgram(mtcars, order=TRUE, lower.panel=panel.ellipse,
         upper.panel=panel.pts, text.panel=panel.txt,
         diag.panel=panel.minmax,
         main="Correlogram of mtcars data using scatter plots and ellipses")
library(corrgram)
#下三角使用阴影,变量顺序不变,上三角留白
corrgram(mtcars, lower.panel=panel.shade,
         upper.panel=NULL, text.panel=panel.txt,
         main="Car Mileage Data (unsorted)")
library(corrgram)
#改变颜色
cols <- colorRampPalette(c("darkgoldenrod4", "burlywood1",
                           "darkkhaki", "darkgreen"))(ncol)}

corrgram(mtcars, order=TRUE, col.regions=cols,
         lower.panel=panel.shade,
         upper.panel=NULL, text.panel=panel.txt,
         main="A Corrgram or Horse of a Different Color")
11.4 马赛克图
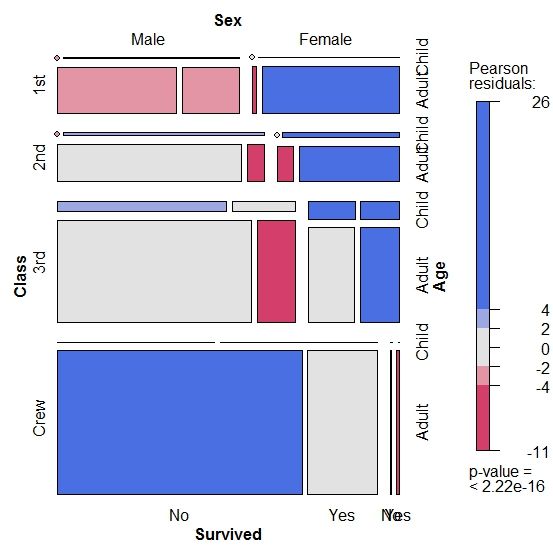
类别型变量可视化,马赛克图(mosaic plot)。
mosaic()函数 via vcd包可绘制马赛克图。(R基础安装中的mosaicplot()也可以绘制马赛克图,但vcd扩展功能更多。)
使用格式:
mosaic(table )
其中table是数组形式的列联表。另外也可用:
mosaic(formula, data= )
其中formula是标准的R表达式,data设定一个数据框或者表格。添加选项shade=TRUE将根据拟合模型的皮尔逊残差值对图形上色,添加选项legend=TRUE将展示残差的图例。
ftable(Titanic)
library(vcd)
mosaic(Titanic, shade=TRUE, legend=TRUE)

mosaic( ~ Class + Sex + Age + Survived, data=Titanic, shade=TRUE, legend=TRUE)
11.5 小结
两个或多个变量间关系的图形方法,包括二维和三维散点图、散点图矩阵、气泡图、折线图、相关系数图和马赛克图。
ps:最近发现了,R脚本编辑模式。还有R markdown。后者还不太会用。
