先说什么叫对称分析(symmetrical analysis),对称分析意味着被分析的两个矩阵之间没有响应和解释变量之分,扮演同样的角色。对称排序与非对称排序的区别类似于相关分析与回归(I类)分析的区别:前者是描述性和探索性分析工具,适用于无因果关系的模型;后者具有推论过程,即通过解释变量的线性组合定向解释响应变量的变化。大部分生态学研究都围绕“处理-响应”的假设进行数据分析,所以非对称分析更合适,这里仅简单介绍几种对称分析方法,以飨读者。
典范相关分析(canonical correlation analysis,CCorA)
CCorA的目的是在最大化数据集两个表格之间相关性的典范轴上排列观测点,可以检验两套多元数据线性独立的假设。
# 载入所需程序包
library(ade4)
library(vegan)
#library(packfor)
rm(list = ls())
setwd("D:\\Users\\Administrator\\Desktop\\RStudio\\数量生态学\\DATA")
# 此程序包可以从 https://r-forge.r-project.org/R/?group_id=195 下载
# 如果是MacOS X系统,packfor程序包内forward.sel函数的运行需要加载
# gfortran程序包。用户必须从"cran.r-project.org"网站内选择"MacOS X",
# 然后选择"tools"安装gfortran程序包。
library(MASS)
library(ellipse)
library(FactoMineR)
# 附加函数
source("evplot.R")
source("hcoplot.R")
# 导入CSV数据文件
spe <- read.csv("DoubsSpe.csv", row.names=1)
env <- read.csv("DoubsEnv.csv", row.names=1)
spa <- read.csv("DoubsSpa.csv", row.names=1)
# 删除没有数据的样方8
spe <- spe[-8, ]
env <- env[-8, ]
spa <- spa[-8, ]
# 提取环境变量das(离源头距离)以备用
das <- env[, 1]
# 从环境变量矩阵剔除das变量
env <- env[, -1]
# 将slope变量(pen)转化为因子(定性)变量
pen2 <- rep("very_steep", nrow(env))
pen2[env$pen <= quantile(env$pen)[4]] = "steep"
pen2[env$pen <= quantile(env$pen)[3]] = "moderate"
pen2[env$pen <= quantile(env$pen)[2]] = "low"
pen2 <- factor(pen2, levels=c("low", "moderate", "steep", "very_steep"))
table(pen2)
# 生成一个含定性坡度变量的环境变量数据框env2
env2 <- env
env2$pen <- pen2
# 将所有解释变量分为两个解释变量子集
# 地形变量(上下游梯度)子集
envtopo <- env[, c(1:3)]
names(envtopo)
#水体化学属性变量子集
envchem <- env[, c(4:10)]
names(envchem)
# 物种数据Hellinger转化
spe.hel <- decostand(spe, "hellinger")
> # 典范相关分析(CCorA)
> # **********************
> # 数据的准备(对数据进行转化使变量分布近似对称)
> envchem2 <- envchem
> envchem2$pho <- log(envchem$pho)
> envchem2$nit <- sqrt(envchem$nit)
> envchem2$amm <- log1p(envchem$amm)
> envchem2$dbo <- log(envchem$dbo)
> envtopo2 <- envtopo
> envtopo2$alt <- log(envtopo$alt)
> envtopo2$pen <- log(envtopo$pen)
> envtopo2$deb <- sqrt(envtopo$deb)
> # CCorA (基于标准化的变量)
> chem.topo.CCorA <- CCorA(envchem2, envtopo2, stand.Y=TRUE, stand.X=TRUE, permutations=999)
> chem.topo.CCorA

Canonical Correlation Analysis

Call:
CCorA(Y = envchem2, X = envtopo2, stand.Y = TRUE, stand.X = TRUE,      permutations = 999)

             Y X
Matrix Ranks 7 3

Pillai's trace:  1.821107

Significance of Pillai's trace:
from F-distribution:   1.1352e-06
based on permutations: 0.001
Permutation: free
Number of permutations: 999

                       CanAxis1 CanAxis2 CanAxis3
Canonical Correlations  0.92100  0.76372   0.6242

                     Y | X  X | Y
RDA R squares      0.49174 0.7821
adj. RDA R squares 0.43075 0.7095

> biplot(chem.topo.CCorA, plot.type="biplot")
oxy 与 alt正相关,依次类推。
协惯量分析(co-intertia anaysis ,CoIA)
处理两个数据矩阵的CoIA计算步骤如下:
- 计算两个数据表内变量交叉的协方差矩阵。协方差矩阵的平方和称为总协惯量。计算协方差矩阵长度特征根和特征向量。特征根代表总协惯量的分解。
- 将两个原始矩阵的对象和变量投影到协惯量的排序图上。根据排序图上两组数据的投影判断他们的关系。
> # 协惯量分析(CoIA)
> # *******************
> # 两个环境变量矩阵的PCA排序
> dudi.chem <- dudi.pca(envchem2, scale=TRUE, scan=FALSE, nf=3)
> dudi.topo <- dudi.pca(envtopo2, scale=TRUE, scan=FALSE, nf=2)
> dudi.chem$eig/sum(dudi.chem$eig) # 每轴特征根比例dudi.topo$eig/sum(dudi.topo$eig) # 每轴特征根比例
[1] 0.62085880 0.17514557 0.10173342 0.04784425 0.02301475 0.01791889 0.01348432
> all.equal(dudi.chem$lw,dudi.topo$lw) #两个分析每行权重是否相等?
[1] TRUE
> # 协惯量分析
> coia.chem.topo <- coinertia(dudi.chem,dudi.topo, scan=FALSE, nf=2)
> coia.chem.topo
Coinertia analysis
call: coinertia(dudiX = dudi.chem, dudiY = dudi.topo, scannf = FALSE,
    nf = 2)
class: coinertia dudi

$rank (rank)     : 3
$nf (axis saved) : 2
$RV (RV coeff)   : 0.5537773

eigenvalues: 6.78 0.05645 0.01618

  vector length mode    content
1 $eig   3      numeric Eigenvalues
2 $lw    3      numeric Row weigths (for dudi.topo cols)
3 $cw    7      numeric Col weigths (for dudi.chem cols)

   data.frame nrow ncol content
1  $tab       3    7    Crossed Table (CT): cols(dudi.topo) x cols(dudi.chem)
2  $li        3    2    CT row scores (cols of dudi.topo)
3  $l1        3    2    Principal components (loadings for dudi.topo cols)
4  $co        7    2    CT col scores (cols of dudi.chem)
5  $c1        7    2    Principal axes (loadings for dudi.chem cols)
6  $lX        29   2    Row scores (rows of dudi.chem)
7  $mX        29   2    Normed row scores (rows of dudi.chem)
8  $lY        29   2    Row scores (rows of dudi.topo)
9  $mY        29   2    Normed row scores (rows of dudi.topo)
10 $aX        3    2    Corr dudi.chem axes / coinertia axes
11 $aY        2    2    Corr dudi.topo axes / coinertia axes

CT rows = cols of dudi.topo (3) / CT cols = cols of dudi.chem (7)
> coia.chem.topo$eig[1]/sum(coia.chem.topo$eig) # 第1个特征根解释量
[1] 0.9894016
> summary(coia.chem.topo)
Coinertia analysis

Class: coinertia dudi
Call: coinertia(dudiX = dudi.chem, dudiY = dudi.topo, scannf = FALSE,
    nf = 2)

Total inertia: 6.853

Eigenvalues:
    Ax1     Ax2     Ax3
6.78050 0.05645 0.01618

Projected inertia (%):
    Ax1     Ax2     Ax3
98.9402  0.8237  0.2361

Cumulative projected inertia (%):
    Ax1   Ax1:2   Ax1:3
  98.94   99.76  100.00

Eigenvalues decomposition:
         eig     covar       sdX       sdY      corr
1 6.78049894 2.6039391 1.9994990 1.6364535 0.7958037
2 0.05644986 0.2375918 0.8714496 0.5354616 0.5091676

Inertia & coinertia X (dudi.chem):
    inertia      max     ratio
1  3.997996 4.346012 0.9199230
12 4.757421 5.572031 0.8538037

Inertia & coinertia Y (dudi.topo):
    inertia      max     ratio
1  2.677980 2.681151 0.9988172
12 2.964699 2.967525 0.9990479

RV:
 0.5537773
> randtest(coia.chem.topo, nrepet=999)    # 置换检验
Monte-Carlo test
Call: randtest.coinertia(xtest = coia.chem.topo, nrepet = 999)

Observation: 0.5537773

Based on 999 replicates
Simulated p-value: 0.001
Alternative hypothesis: greater

     Std.Obs  Expectation     Variance
11.211685860  0.059422647  0.001944175
> plot(coia.chem.topo)
多元因子分析(multiple factor ,analysis,MFA )
> # 多元因子分析(MFA)
> # *******************
> # 三组变量的MFA
> # 组合三个表格(Hellinger转化的物种数据、地形变量和水体化学属性)
> tab3 <- data.frame(spe.hel, envtopo, envchem)
> dim(tab3)
[1] 29 37
> (grn <- c(ncol(spe), ncol(envtopo), ncol(envchem)))
[1] 27  3  7
> # 计算MFA(附带多图)
> # graphics.off()  # 关闭前面的绘图窗口
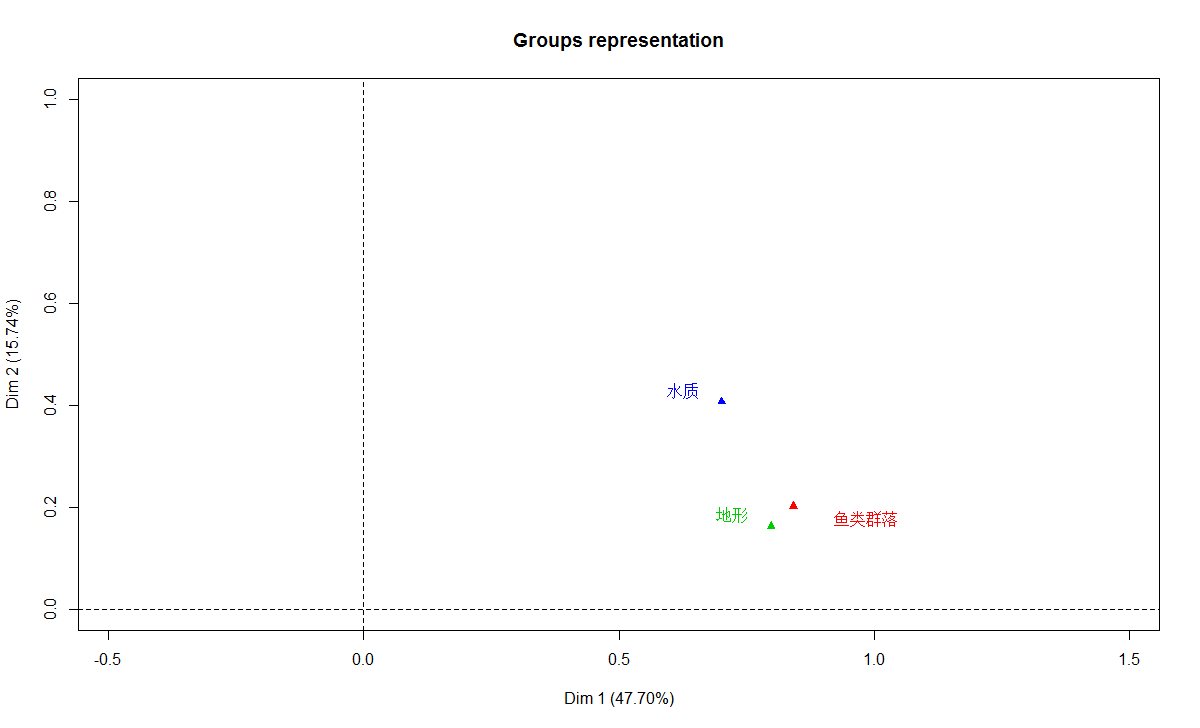
> t3.mfa <- MFA(tab3, group=grn, type=c("c","s","s"), ncp=2,
+   name.group=c("鱼类群落","地形","水质"))
> t3.mfa
**Results of the Multiple Factor Analysis (MFA)**
The analysis was performed on 29 individuals, described by 37 variables
*Results are available in the following objects :

  name                 description
1 "$eig"               "eigenvalues"
2 "$separate.analyses" "separate analyses for each group of variables"
3 "$group"             "results for all the groups"
4 "$partial.axes"      "results for the partial axes"
5 "$inertia.ratio"     "inertia ratio"
6 "$ind"               "results for the individuals"
7 "$quanti.var"        "results for the quantitative variables"
8 "$summary.quanti"    "summary for the quantitative variables"
9 "$global.pca"        "results for the global PCA"
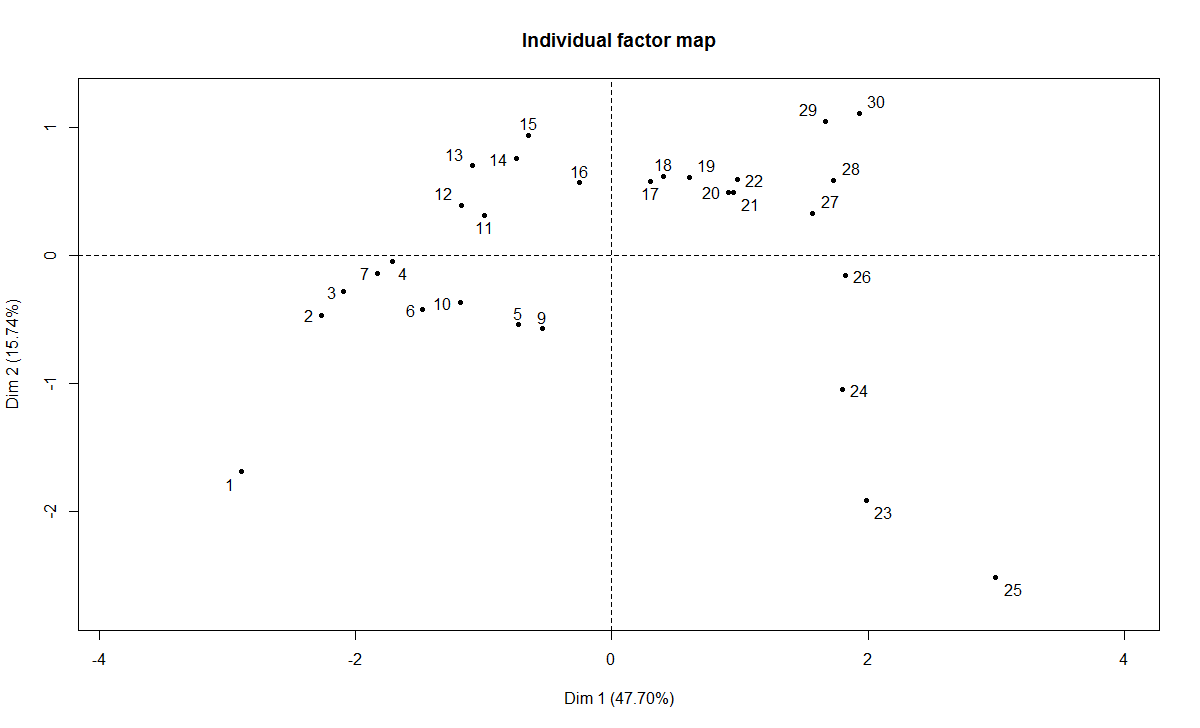
plot(t3.mfa, choix="ind", habillage="none")
plot(t3.mfa, choix="ind", habillage="none", partial="all")
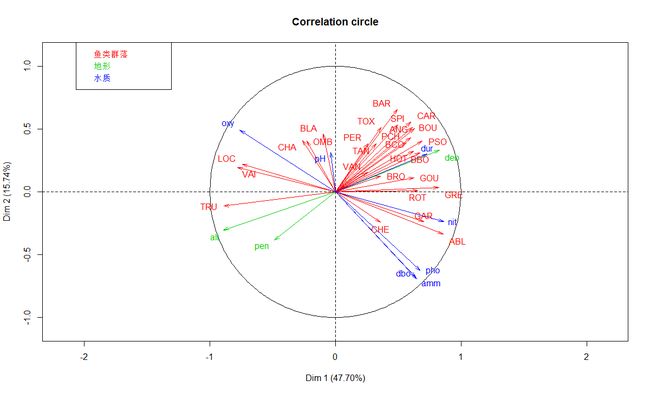
plot(t3.mfa, choix="var", habillage="group")
plot(t3.mfa, choix="axes")
> # RV系数及检验
>  (rvp <- t3.mfa$group$RV)
          鱼类群落      地形      水质       MFA
鱼类群落 1.0000000 0.5802803 0.5053235 0.8604235
地形     0.5802803 1.0000000 0.3618737 0.8002752
水质     0.5053235 0.3618737 1.0000000 0.7672412
MFA      0.8604235 0.8002752 0.7672412 1.0000000
> rvp[1,2] <- coeffRV(spe.hel, scale(envtopo))$p.value
> rvp[1,3] <- coeffRV(spe.hel, scale(envchem))$p.value
> rvp[2,3] <- coeffRV(scale(envtopo), scale(envchem))$p.value
> round(rvp[-4,-4], 6)
         鱼类群落     地形     水质
鱼类群落 1.000000 0.000002 0.000002
地形     0.580280 1.000000 0.002811
水质     0.505324 0.361874 1.000000
> # 特征根和方差百分百
> t3.mfa$eig
          eigenvalue percentage of variance cumulative percentage of variance
comp 1  2.3406761135           47.703588747                          47.70359
comp 2  0.7725455009           15.744678493                          63.44827
comp 3  0.5134558271           10.464363469                          73.91263
comp 4  0.3773033186            7.689539890                          81.60217
comp 5  0.2006821321            4.089954113                          85.69212
comp 6  0.1537343955            3.133147015                          88.82527
comp 7  0.1336609567            2.724045105                          91.54932
comp 8  0.1075494099            2.191884981                          93.74120
comp 9  0.0568909440            1.159452254                          94.90065
comp 10 0.0471241618            0.960402690                          95.86106
comp 11 0.0411904958            0.839473032                          96.70053
comp 12 0.0301940493            0.615362589                          97.31589
comp 13 0.0278536386            0.567664408                          97.88356
comp 14 0.0200600195            0.408828422                          98.29239
comp 15 0.0189179899            0.385553561                          98.67794
comp 16 0.0152012570            0.309805577                          98.98774
comp 17 0.0119765023            0.244084236                          99.23183
comp 18 0.0093145099            0.189832137                          99.42166
comp 19 0.0068523708            0.139653101                          99.56131
comp 20 0.0060259428            0.122810283                          99.68412
comp 21 0.0054933843            0.111956602                          99.79608
comp 22 0.0032748975            0.066743264                          99.86282
comp 23 0.0027672695            0.056397672                          99.91922
comp 24 0.0016028422            0.032666342                          99.95189
comp 25 0.0011209475            0.022845203                          99.97473
comp 26 0.0007359563            0.014998981                          99.98973
comp 27 0.0003982184            0.008115794                          99.99785
comp 28 0.0001055944            0.002152041                         100.00000
> ev <- t3.mfa$eig[,1]
> names(ev) <- 1:nrow(t3.mfa$eig)
evplot(ev)
aa <- dimdesc(t3.mfa, axes=1:2, proba=0.0001)
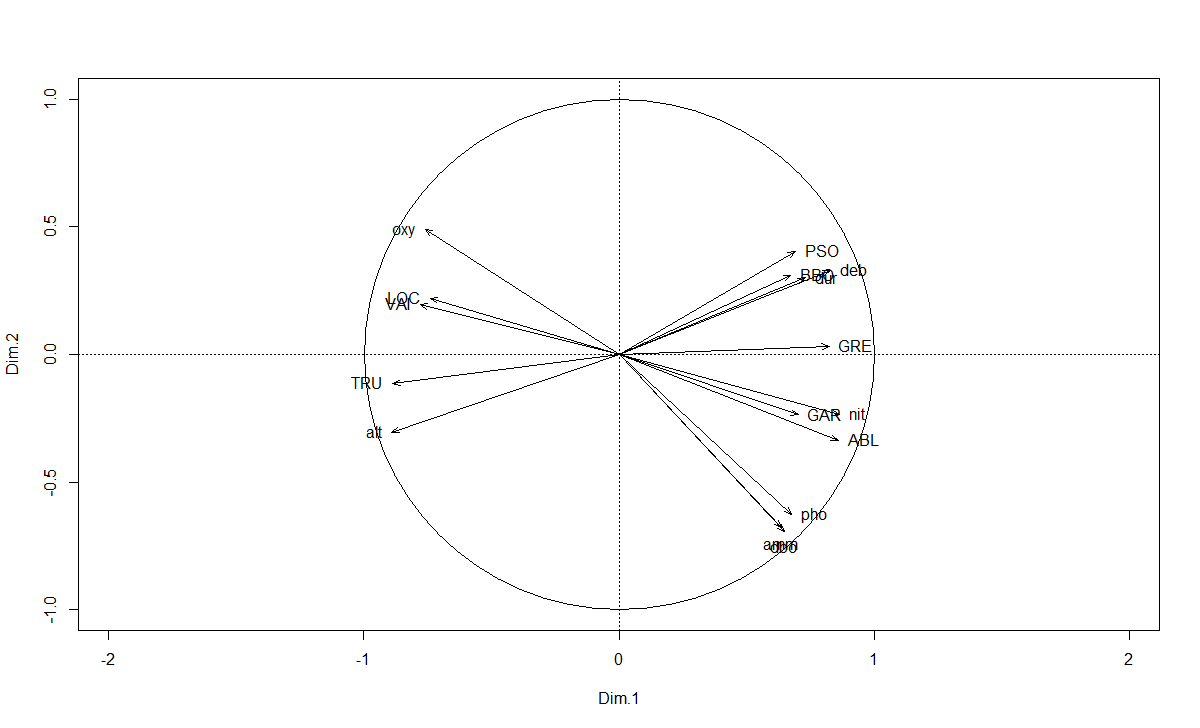
# 保留最显著(相关性)的变量排序图
varsig <- t3.mfa$quanti.var$cor[unique(c(rownames(aa$Dim.1$quanti),
  rownames(aa$Dim.2$quanti))),]
plot(varsig[,1:2], asp=1, type="n", xlim=c(-1,1), ylim=c(-1,1))
abline(h=0, lty=3)
abline(v=0, lty=3)
symbols(0, 0, circles=1, inches=FALSE, add=TRUE)
arrows(0, 0, varsig[,1], varsig[,2], length=0.08, angle=20)
for (v in 1:nrow(varsig)) {
  if (abs(varsig[v,1]) > abs(varsig[v,2])) {
    if (varsig[v,1] >= 0) pos <- 4
    else pos <- 2
    }
  else {
    if (varsig[v,2] >= 0) pos <- 3
    else pos <- 1
    }
  text(varsig[v,1], varsig[v,2], labels=rownames(varsig)[v], pos=pos)
}
参考
典型相关与对应分析
Lesson 13: Canonical Correlation Analysis


