原创
MXNet之数据读取与增强
2019-06-26 10:07:52 沧海二阳
阅读数 212
数据读取与增强
- 1.直接读取原图像数据
- 1.1 生成.lst文件
- 1.2 基本数据读取方式read_lst.py
- 2. 基于RecordIO文件读取数据
- 1.生成RecordIO文件
- 2.2 RecordIO数据读取方式read_rec.py
- 3.数据增强
- 3.1大小重置(resize)
- 3.2 裁剪(crop)
- 3.3 镜像(mirror)
- 3.4 亮度 (brightness)
- 3.5 对比度(contrast)
- 3.6 饱和度(saturation)
1.直接读取原图像数据
1.1 生成.lst文件
im2rec.py脚本用于生成,lst文件.
文件目录:


执行下面指令,生成.lst文件.
(mxnet) yuyang@oceanshadow:~/下载/MXNet-Deep-Learning-in-Action-master/demo5$ python /tools/im2rec.py data/train data/train --list --recursive
python: can't open file '/tools/im2rec.py': [Errno 2] No such file or directory
(mxnet) yuyang@oceanshadow:~/下载/MXNet-Deep-Learning-in-Action-master/demo5$ python ./tools/im2rec.py data/train data/train --list --recursive
cock 0
ostrich 1
(mxnet) yuyang@oceanshadow:~/下载/MXNet-Deep-Learning-in-Action-master/demo5$ python ./tools/im2rec.py data/val data/val --list --recursive
cock 0
ostrich 1
- 1
- 2
- 3
- 4
- 5
- 6
- 7
- 8
- 9
- 10
- 11
- 12
- 13
结果:

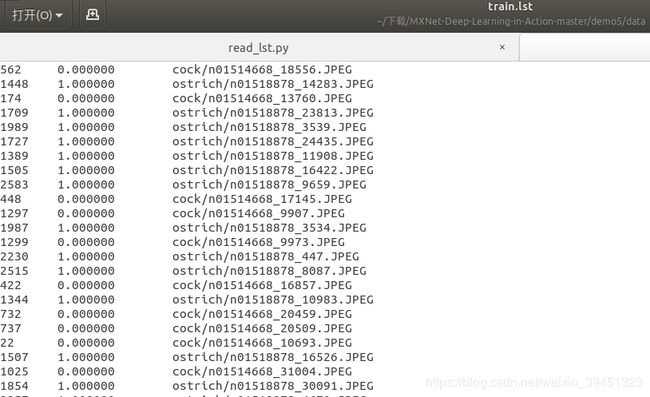
1.2 基本数据读取方式read_lst.py
import mxnet as mx
import matplotlib.pyplot as plt
train_data = mx.image.ImageIter(batch_size=32,
data_shape=(3,224,224),
path_imglist=‘data/train.lst’,
path_root=‘data/train’,
shuffle=True)
val_data = mx.image.ImageIter(batch_size=32,
data_shape=(3,224,224),
path_imglist=‘data/val.lst’,
path_root=‘data/val’)
train_data.reset()
print(train_data)
data_batch = train_data.next()
print(data_batch)
data = data_batch.data[0]
plt.figure()
for i in range(4):
save_image = data[i].astype(‘uint8’).asnumpy().transpose((1,2,0))
plt.subplot(1,4,i+1)
plt.imshow(save_image)
plt.savefig(‘image_sample.jpg’)
train_data = mx.image.ImageIter(batch_size=32,
data_shape=(3, 224, 224),
path_imglist=‘data/train.lst’,
path_root=‘data/train’,
shuffle=True,
resize=256,
rand_mirror=True)
- 1
- 2
- 3
- 4
- 5
- 6
- 7
- 8
- 9
- 10
- 11
- 12
- 13
- 14
- 15
- 16
- 17
- 18
- 19
- 20
- 21
- 22
- 23
- 24
- 25
- 26
- 27
- 28
- 29
- 30
- 31
- 32
- 33
输出结果:
<mxnet.image.image.ImageIter object at 0x7fc7ac5839e8>
DataBatch: data shapes: [(32, 3, 224, 224)] label shapes: [(32,)]

2. 基于RecordIO文件读取数据
1.生成RecordIO文件
(mxnet) yuyang@oceanshadow:~/下载/MXNet-Deep-Learning-in-Action-master/demo5$ python ./tools/im2rec.py --num-thread 16 data/train.lst data/train
Creating .rec file from /home/yuyang/下载/MXNet-Deep-Learning-in-Action-master/demo5/data/train.lst in /home/yuyang/下载/MXNet-Deep-Learning-in-Action-master/demo5/data
time: 0.009440183639526367 count: 0
time: 0.8572912216186523 count: 1000
time: 0.8444476127624512 count: 2000
(mxnet) yuyang@oceanshadow:~/下载/MXNet-Deep-Learning-in-Action-master/demo5$ python ./tools/im2rec.py --num-thread 16 data/val.lst data/val
Creating .rec file from /home/yuyang/下载/MXNet-Deep-Learning-in-Action-master/demo5/data/val.lst in /home/yuyang/下载/MXNet-Deep-Learning-in-Action-master/demo5/data
time: 0.014867544174194336 count: 0
结果:

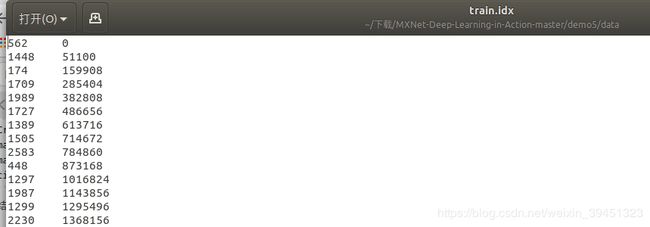
2.2 RecordIO数据读取方式read_rec.py
mx.io.ImageRecordIter()接口用于读取RecordIO数据文件,接口参数多大数十个,以下代码简介:
import mxnet as mx
import matplotlib.pyplot as plt
train_data = mx.io.ImageRecordIter(batch_size=32,
data_shape=(3,224,224),
path_imgrec='data/train.rec',
path_imgidx='data/train.idx',
shuffle=True,
resize=256,
rand_mirror=True)
val_data = mx.io.ImageRecordIter(batch_size=32,
data_shape=(3,224,224),
path_imgrec=‘data/val.rec’,
path_imgidx=‘data/val.idx’,
resize=256)
train_data.reset()
data_batch = train_data.next()
data = data_batch.data[0]
plt.figure()
for i in range(4):
save_image = data[i].astype(‘uint8’).asnumpy().transpose((1,2,0))
plt.subplot(1,4,i+1)
plt.imshow(save_image)
plt.savefig(‘image_sample_rec.jpg’)
- 1
- 2
- 3
- 4
- 5
- 6
- 7
- 8
- 9
- 10
- 11
- 12
- 13
- 14
- 15
- 16
- 17
- 18
- 19
- 20
- 21
- 22
- 23
- 24
- 25
- 26
输出结果:
<mxnet.io.io.MXDataIter object at 0x7fc7ac62fa58>
DataBatch: data shapes: [(32, 3, 224, 224)] label shapes: [(32,)]

3.数据增强
3.1大小重置(resize)
- mx.image.ResizeAug(size=)
- mx.image.ForceResizeAug(size=(224,224))
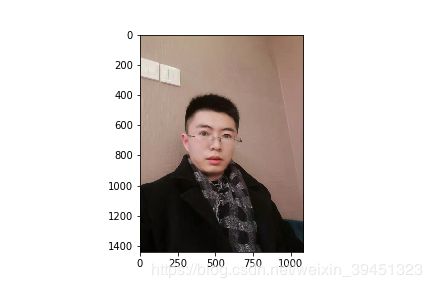
import matplotlib.pyplot as plt
import mxnet as mx
if name == ‘main’:
prefix = ‘data-augmentation/resize/’
image = ‘ILSVRC2012_val_00000002.jpg’
image_name = image.split(".")[0]
image_string = open(‘data-augmentation/resize/{}’.format(image), ‘rb’).read()
data = mx.image.imdecode(image_string, flag=1)
print(“Shape of data:{}”.format(data.shape))
plt.imshow(data.asnumpy())
plt.savefig(’{}_original.png’.format(prefix + image_name))
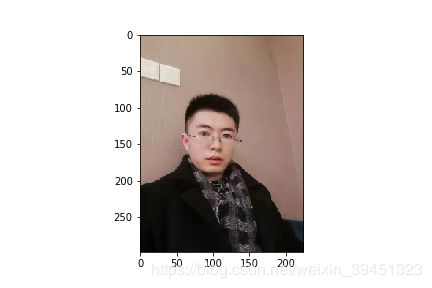
shorterResize = mx.image.ResizeAug(size=224, interp=2)
shorterResize_data = shorterResize(data)
print("Shape of data:{}".format(shorterResize_data.shape))
plt.imshow(shorterResize_data.asnumpy())
plt.savefig('{}_shorterResize.png'.format(prefix + image_name))
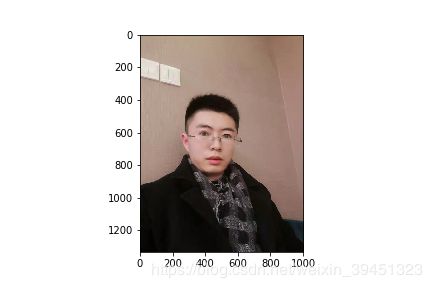
shorterResize = mx.image.ResizeAug(size=1000)
shorterResize_data = shorterResize(data)
print("Shape of data:{}".format(shorterResize_data.shape))
plt.imshow(shorterResize_data.asnumpy())
plt.savefig('{}_shorterResize_bigsize.png'.format(prefix + image_name))
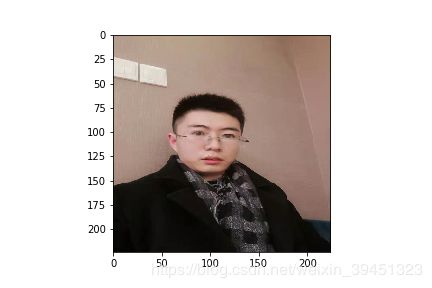
forceResize = mx.image.ForceResizeAug(size=(224,224))
forceResize_data = forceResize(data)
print("Shape of data:{}".format(forceResize_data.shape))
plt.imshow(forceResize_data.asnumpy())
plt.savefig('{}_forceResize.png'.format(prefix + image_name))
forceResize = mx.image.ForceResizeAug(size=(200, 300))
forceResize_data = forceResize(data)
print("Shape of data:{}".format(forceResize_data.shape))
plt.imshow(forceResize_data.asnumpy())
plt.savefig('{}_forceResize_diff.png'.format(prefix + image_name))
- 1
- 2
- 3
- 4
- 5
- 6
- 7
- 8
- 9
- 10
- 11
- 12
- 13
- 14
- 15
- 16
- 17
- 18
- 19
- 20
- 21
- 22
- 23
- 24
- 25
- 26
- 27
- 28
- 29
- 30
- 31
- 32
- 33
- 34
- 35
- 36
- 37
- 38
- 39
- 40
输出结果:
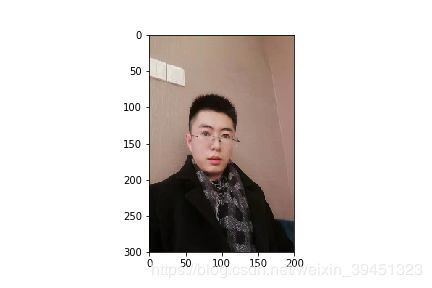
Shape of data:(1440, 1080, 3)
Shape of data:(298, 224, 3)
Shape of data:(1333, 1000, 3)
Shape of data:(224, 224, 3)
Shape of data:(300, 200, 3)

3.2 裁剪(crop)
- center crop
- random crop
- random resize crop
import matplotlib.pyplot as plt
import mxnet as mx
if name == ‘main’:
prefix = ‘data-augmentation/crop/’
image = ‘ILSVRC2012_val_00000009.jpg’
image_name = image.split(".")[0]
image_string = open(‘data-augmentation/crop/{}’.format(image), ‘rb’).read()
data = mx.image.imdecode(image_string, flag=1)
print(“Shape of data:{}”.format(data.shape))
plt.imshow(data.asnumpy())
plt.savefig(’{}_original.png’.format(prefix + image_name))
centerCrop = mx.image.CenterCropAug(size=(224,224))
class_centerCrop_data = centerCrop(data)
print(“Shape of data:{}”.format(class_centerCrop_data.shape))
plt.imshow(class_centerCrop_data.asnumpy())
plt.savefig(’{}_centerCrop.png’.format(prefix + image_name))
randomCrop = mx.image.RandomCropAug(size=(224,224))
class_randomCrop_data = randomCrop(data)
print(“Shape of data:{}”.format(class_randomCrop_data.shape))
plt.imshow(class_randomCrop_data.asnumpy())
plt.savefig(’{}_randomCrop.png’.format(prefix + image_name))
randomSizeCrop = mx.image.RandomSizedCropAug(size=(224,224), area=0.08,
ratio=(3/4, 4/3))
class_randomSizedCrop_data = randomSizeCrop(data)
print(“Shape of data:{}”.format(class_randomSizedCrop_data.shape))
plt.imshow(class_randomSizedCrop_data.asnumpy())
plt.savefig(’{}_randomSizedCrop.png’.format(prefix + image_name))
- 1
- 2
- 3
- 4
- 5
- 6
- 7
- 8
- 9
- 10
- 11
- 12
- 13
- 14
- 15
- 16
- 17
- 18
- 19
- 20
- 21
- 22
- 23
- 24
- 25
- 26
- 27
- 28
- 29
- 30
- 31
- 32
- 33
- 34
输出结果:
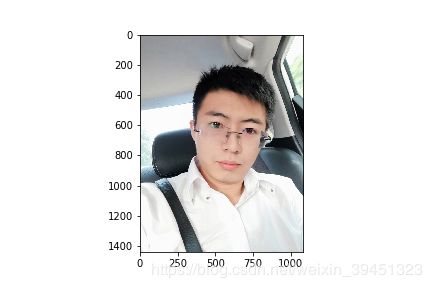
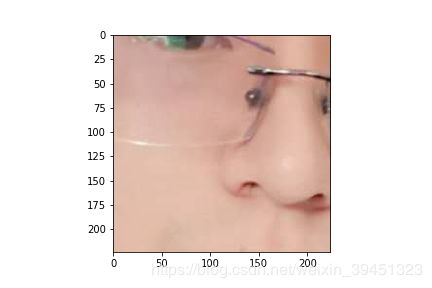
Shape of data:(1440, 1080, 3)
Shape of data:(224, 224, 3)
Shape of data:(224, 224, 3)
Shape of data:(224, 224, 3)

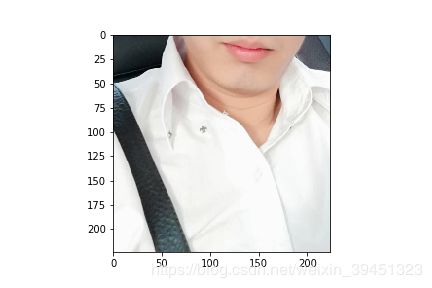
3.3 镜像(mirror)
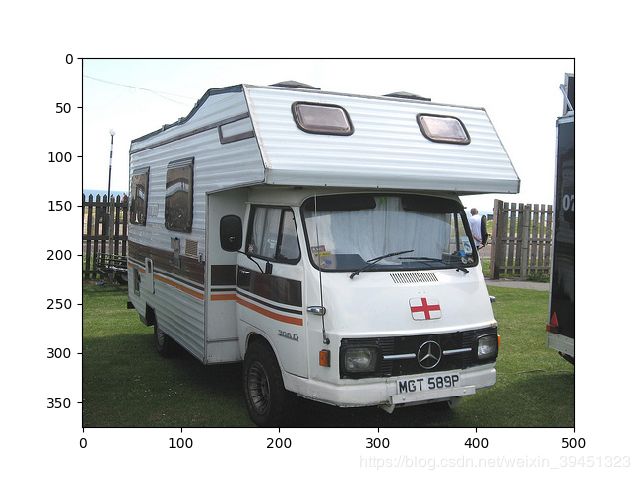
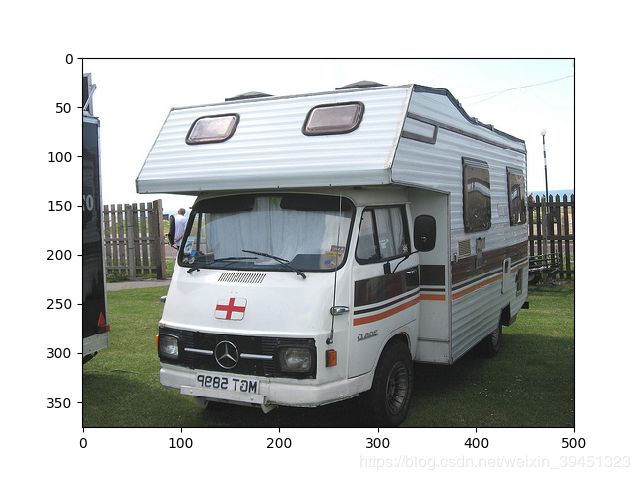
- mx.image.HorizontalFlipAug(p=0.5)
import matplotlib.pyplot as plt
import mxnet as mx
if name == ‘main’:
image = ‘ILSVRC2012_val_00000014.JPEG’
image_name = image.split(".")[0]
image_string = open(’…/image/{}’.format(image), ‘rb’).read()
data = mx.image.imdecode(image_string, flag=1)
print(“Shape of data:{}”.format(data.shape))
plt.imshow(data.asnumpy())
plt.savefig(’{}_original.png’.format(image_name))
mirror = mx.image.HorizontalFlipAug(p=0.5)
mirror_data = mirror(data)
plt.imshow(mirror_data.asnumpy())
plt.savefig(’{}_mirror.png’.format(image_name))
- 1
- 2
- 3
- 4
- 5
- 6
- 7
- 8
- 9
- 10
- 11
- 12
- 13
- 14
- 15
- 16
- 17
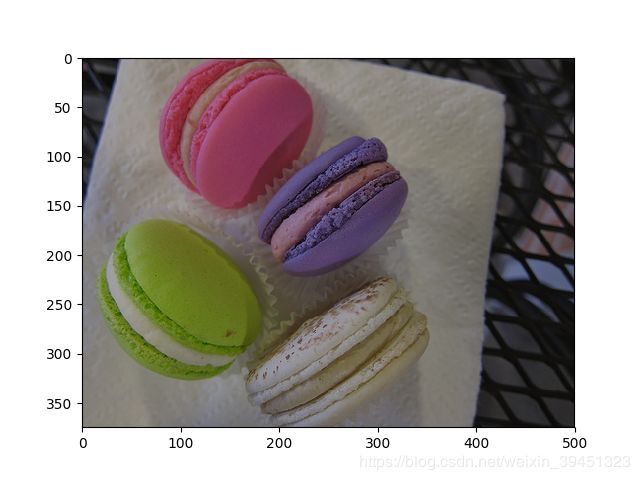
3.4 亮度 (brightness)
- mx.image.BrightnessJitterAug(brightness=0.3)
亮度不宜设置过大,否则失真
输出图像:输入图像的像素值乘以[1+brightness,1-brightness]中间的随机数的到的图像
import matplotlib.pyplot as plt
import mxnet as mx
if name == ‘main’:
image = ‘ILSVRC2012_val_00000008.JPEG’
image_name = image.split(".")[0]
image_string = open(’…/image/{}’.format(image), ‘rb’).read()
data = mx.image.imdecode(image_string, flag=1)
plt.imshow(data.asnumpy())
plt.savefig(’{}_original.png’.format(image_name))
cast = mx.image.CastAug()
data = cast(data)
brightness = mx.image.BrightnessJitterAug(brightness=0.3)
brightness_data = brightness(data)
brightness_data = mx.nd.Cast(brightness_data, dtype=‘uint8’)
plt.imshow(brightness_data.asnumpy())
plt.savefig(’{}_brightness.png’.format(image_name))
- 1
- 2
- 3
- 4
- 5
- 6
- 7
- 8
- 9
- 10
- 11
- 12
- 13
- 14
- 15
- 16
- 17
- 18
输出结果: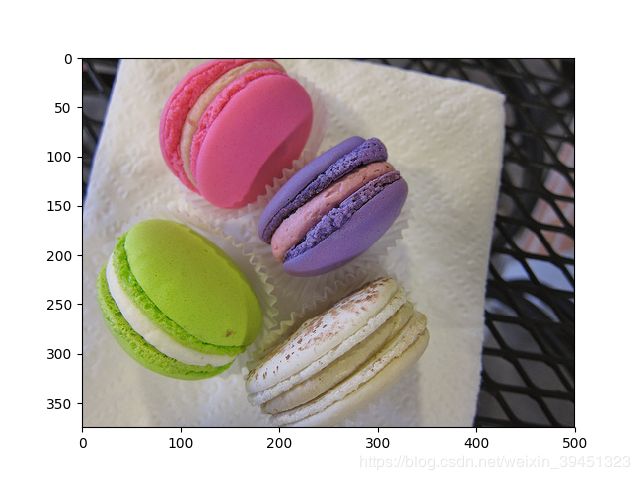
3.5 对比度(contrast)
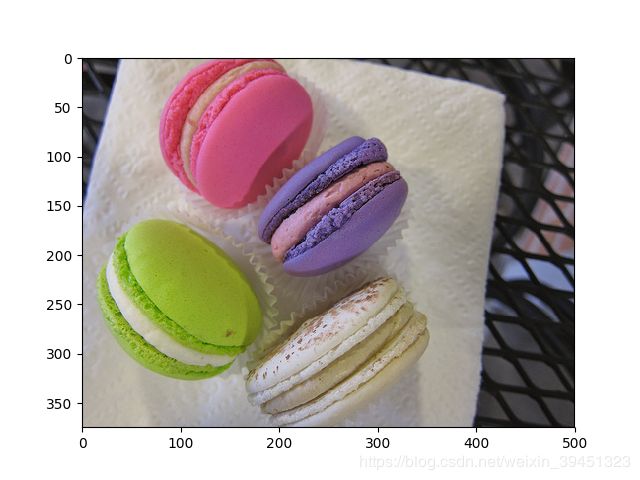
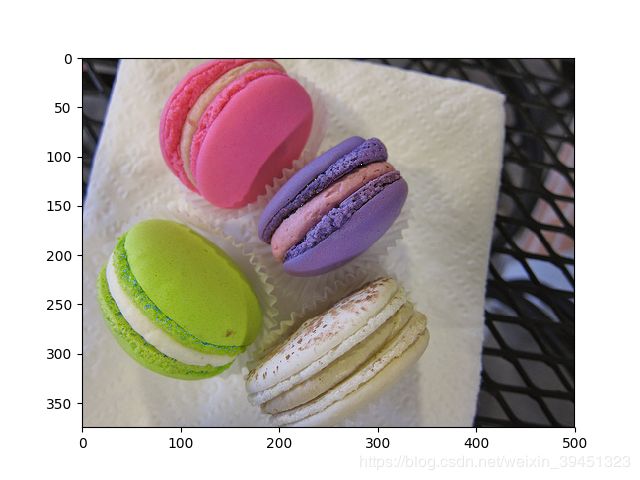
- mx.image.ContrastJitterAug(contrast=0.3)
对比度不宜设置过大,否则失真
import matplotlib.pyplot as plt
import mxnet as mx
if name == ‘main’:
image = ‘ILSVRC2012_val_00000008.JPEG’
image_name = image.split(".")[0]
image_string = open(’…/image/{}’.format(image), ‘rb’).read()
data = mx.image.imdecode(image_string, flag=1)
plt.imshow(data.asnumpy())
plt.savefig(’{}_original.png’.format(image_name))
cast = mx.image.CastAug()
data = cast(data)
contrast = mx.image.ContrastJitterAug(contrast=0.3)
contrast_data = contrast(data)
contrast_data = mx.nd.Cast(contrast_data, dtype=‘uint8’)
plt.imshow(contrast_data.asnumpy())
plt.savefig(’{}_contrast.png’.format(image_name))
- 1
- 2
- 3
- 4
- 5
- 6
- 7
- 8
- 9
- 10
- 11
- 12
- 13
- 14
- 15
- 16
- 17
- 18
输出结果:
3.6 饱和度(saturation)
- saturation = mx.image.SaturationJitterAug(saturation=0.3)
饱和度指色彩纯度,纯度越高表现越鲜明,越低表现越黯淡.
import matplotlib.pyplot as plt
import mxnet as mx
if name == ‘main’:
image = ‘ILSVRC2012_val_00000008.JPEG’
image_name = image.split(".")[0]
image_string = open(’…/image/{}’.format(image), ‘rb’).read()
data = mx.image.imdecode(image_string, flag=1)
plt.imshow(data.asnumpy())
plt.savefig(’{}_original.png’.format(image_name))
cast = mx.image.CastAug()
data = cast(data)
saturation = mx.image.SaturationJitterAug(saturation=0.3)
saturation_data = saturation(data)
saturation_data = mx.nd.Cast(saturation_data, dtype=‘uint8’)
plt.imshow(saturation_data.asnumpy())
plt.savefig(’{}_saturation.png’.format(image_name))
- 1
- 2
- 3
- 4
- 5
- 6
- 7
- 8
- 9
- 10
- 11
- 12
- 13
- 14
- 15
- 16
- 17
- 18
- 19
输出结果:
