python可视化工具:matplotlib+pyecharts使用详解
-
-
- 准备
- 一、matplotlib快速入门
- 二、matplotlib进阶–绘制常见的图表
- 1、绘制折线图
- 2、绘制柱状图
- 3、绘制条形图
- 4、绘制直方图
- 5、绘制饼状图
- 6、绘制散点图
- 7、绘制堆叠图
- 三、matplotlib进阶–综合应用
- 四、matplotlib进阶-优化图形
- 1、优化柱状图
- 2、利用subplot绘制多幅图形
- 五、matplotlib进阶–加载数据文件进行可视化
- 1、直接根据数据绘制折线图
- 2、用numpy加载csv数据
- 3、加载网络接口数据
- 六、matplotlib进阶–pandas简化数据可视化
- 1、利用Series绘制折线图
- 2、利用DtaFrame进行绘图
- 3、绘制柱状图和条形图
- 4、绘制直方图
- 5、绘制箱线图
- 6、分组绘图
- 7、绘制堆积图
- 8、绘制散点图
- 9、绘制气泡图
- 9、绘制饼状图
- 七、绘图利器PyEcharts
- 前导安装
- 1、绘制柱状图
- 2、根据柱状图绘制堆积图
- 3、绘制折线图
- 4、折线图修改标注点的形状和标注文字的字体颜色
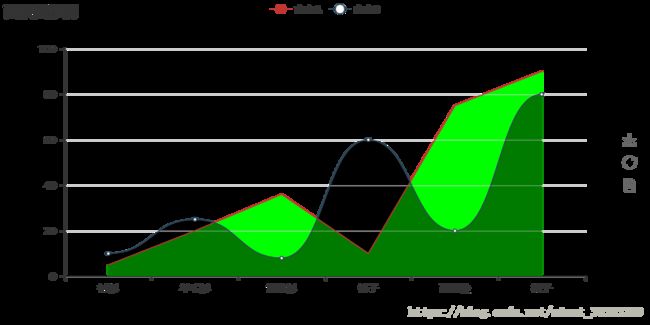
- 5、折线图–面积图示例
- 6、画饼图
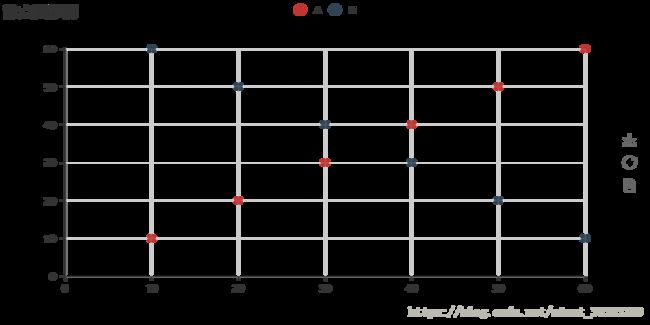
- 7、散点图
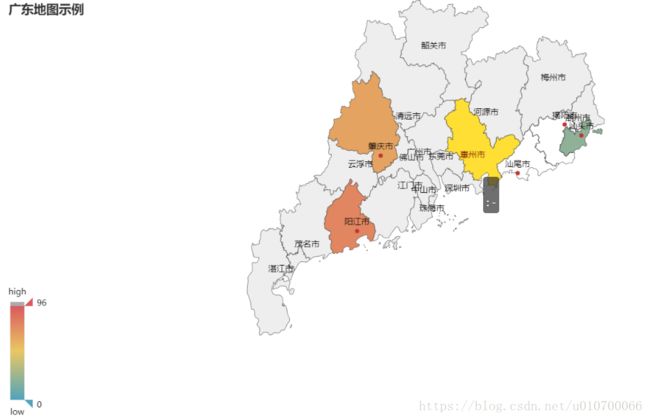
- 8、绘制地图
- 9、绘制词云
- 参考文献:
-
- matplotlib官方使用指南
- matplotlib图例使用模板
- pyecharts官方文档
-
-
准备
安装命令:pip install matplotlib
使用环境:jupyter
开发工具版本:python3
一、matplotlib快速入门
调用 figure 创建一个绘图对象: plt.figure(figsize=(8,4))
- 也可以不创建绘图对象直接调用接下来的plot函数直接绘图, matplotlib会为我们自创建一个绘图对象。
- 如果需要同时绘制多幅图表的话,可以是给figure传递一个整数参数指定图标的序号,如果所指定序号的绘图对象已经存在的话,将不创建新的对象,而只是让它成为当前绘图对象。
- figsize: 指定绘图对象的宽度和高度,单位为英寸;
- dpi: 指定绘图对象的分辨率,每英寸多少个像素,缺省值为80。因此本例中所创建的图表窗口的宽度为8*80 = 640像素,高度为4*80像素质。
from matplotlib import pyplot as plt
# 中文转换
plt.rcParams['font.sans-serif'] = ['SimHei']  # 指定默认字体
plt.rcParams['axes.unicode_minus'] = False  # 解决保存图像是负号'-'显示为方块的问题


# 创建画板
plt.Figure(figsize=(8,4))
#在画板对象上绘制一条折线图
plt.plot([1,2,3,4],[4,5,3,15],label='第一条折线')   # label是小图标的注解
plt.plot([2,3,4],[10,14,12],label = '第二条折线')
# 进一步完善图表

#添加x轴标签,y轴标签
plt.xlabel('X轴')
plt.ylabel('Y轴')

# 为图表添加标题
plt.title('简单的折线图')
# 为图表添加小图标

plt.legend(loc = 'upper right')   #确定小图标的位置
# 显示图表
plt.show() # 在jupyter中不需要打印二、matplotlib进阶–绘制常见的图表
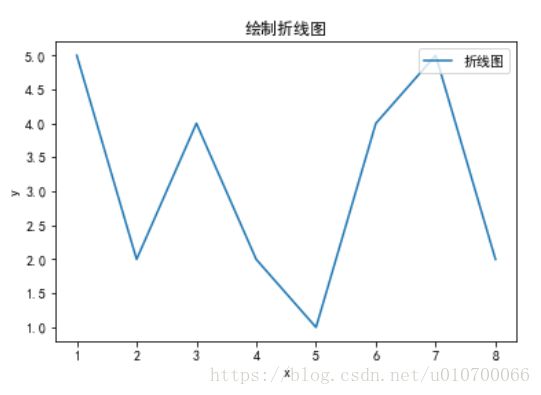
1、绘制折线图
- 适用场景:折线图适合二维的大数据集,还适合多个二维数据集的比较。一般用来表示趋势的变化,横轴一般为日期字段
- 优势:容易反应出数据变化的趋势。
# 一,绘制折线图
x = [1,2,3,4,5,6,7,8]
y = [5,2,4,2,1,4,5,2]
plt.plot(x,y,label='折线图')
plt.title('绘制折线图')
plt.legend(loc='upper right')
plt.xlabel('x')
plt.ylabel('y')
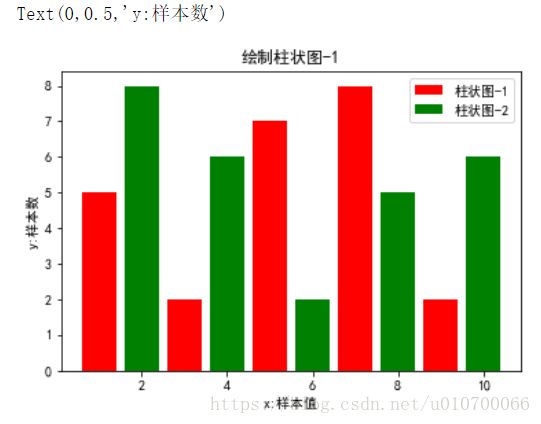
2、绘制柱状图
- 适用场景:显示各个项目之间的比较情况,和柱状图类似的作用
- 优势:每个条都清晰表示数据,直观
- 劣势:柱状图的局限在于只适用中小规模的数据集
- 延伸图表:堆积条形图、百分比堆积条形图
# 绘制柱状图
x,y,x2,y2 = [1,3,5,7,9],[5,2,7,8,2],[2,4,6,8,10],[8,6,2,5,6]
plt.bar(x,y,label='柱状图-1',color='r')
plt.bar(x2,y2,label='柱状图-2',color='g') # 通过color指定颜色
plt.title('绘制柱状图-1')
plt.legend(loc='upper right')
plt.xlabel('x:样本值')
plt.ylabel('y:样本数')
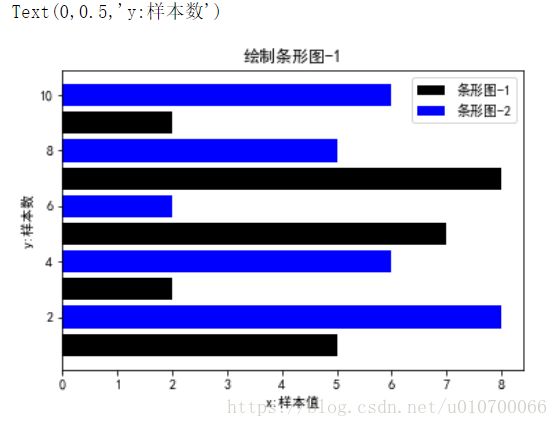
3、绘制条形图
• plt.barh 为我们创建条形图。本质上条形图就是横向的柱状图,故两个的配置几乎完全相同
• 不同的是一般用柱状图表达数据较少的数据,如果数据量较大(超过10条),建议可以用条形图
# 绘制条形
x,y,x2,y2 = [1,3,5,7,9],[5,2,7,8,2],[2,4,6,8,10],[8,6,2,5,6]
# plt.barh(x,y,label='条形图-1',color='r')
# plt.barh(x2,y2,label='条形图-2',color='g') # 通过color指定颜色
plt.barh(x,y,label='条形图-1',color='#000000')
plt.barh(x2,y2,label='条形图-2',color='#0000FF') # 通过color指定颜色
plt.title('绘制条形图-1')
plt.legend(loc='upper right')
plt.xlabel('x:样本值')
plt.ylabel('y:样本数')
4、绘制直方图
直方图又称质量分布图,它是表示资料变化情况的一种主要工具。
用直方图可以解析出资料的规则性,比较直观地看出产品质量特性的分布状态,对于资料分布状况一目了然,便于判断其总体质量分布情况。
# 绘制直方图:直观显示产品的总体质量分布  如:频率分布直方图
population_ages = [22,55,62,45,21,22,34,42,42,4,99,102,110,120,121,122,130,111,115,112,80,75,65,54,44,43,42,48]
# 划分的区间
bins = [0,10,20,30,40,50,60,70,80,90,100,110,120,130]
plt.hist(population_ages,bins,histtype='bar',label='年龄分布情况')
plt.xlabel('x:年龄区间')
plt.ylabel('y:人数')
plt.title('年龄分布直方图')
5、绘制饼状图
- 适用场景:显示各项的大小与各项总和的比例。适用简单的占比比例图,在不要求数据精细的情况适用。
- 优势:明确显示数据的比例情况,尤其合适渠道来源等场景
- 劣势:不会具体的数值,只是整体的占比情况。
audience = [2,5,10,3]
types = ['少年','青年','中年','老年']

# 定义每一个扇图的颜色
# colors = ['#ff0000','#00ff00','#cccccc','#000000']
colors = ['c','m','g','b']
plt.pie(audience,
       labels=types,  #扇形取余的标注
       autopct='%1.1f%%', #扇形取余的显示百分比
       colors=colors,  #扇形区域的颜色
        startangle=90,  #开始绘制扇形取余的角度
        explode = [0.2,0,0,0],  # 突出显示某一扇形区,数值取(0-1)之间
        shadow=True  # 是否显示阴影
       )
plt.title("关注世界杯的人数占比")
plt.show()
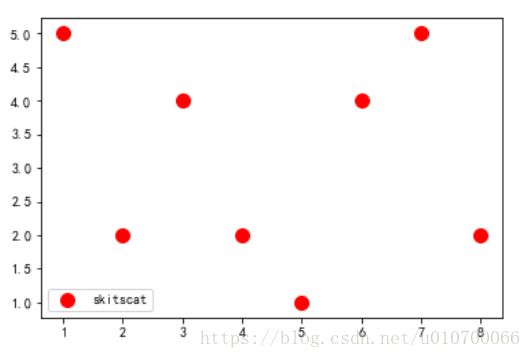
6、绘制散点图
- 适用场景:显示若干数据系列中各数值之间的关系,类似XY轴,判断两变量之间是否存在某种关联。散点图适用于三维数据集,但其中只有两维数据是需要比较的。另外,散点图还可以看出极值的分布情况
- 优势:对于处理值的分布和数据点的分簇区域(通过设置横纵项的辅助线),散点图都很理想。如果数据集中包含非常多的点,那么散点图便是最佳图表类型
- 劣势:在点状图中显示多个序列看上去非常混乱
# 绘制散点图
x,y = [1,2,3,4,5,6,7,8],[5,2,4,2,1,4,5,2]
# x,y表示x,y轴坐标,color点的颜色,s点的大小,marker显示点的形状 label是独立注解
plt.scatter(x,y,color = 'r',s=100,marker='o',label = 'skitscat')
plt.legend()
7、绘制堆叠图
- 堆叠图用于显示『部分对整体』 随时间的关系。 堆叠图基本上类似于饼图,只是随时间而变化。
- 让我们考虑一个情况,我们一天有24 小时,我们想看看我们如何花费时间。 我们将我们的活动分为:睡觉,吃饭,工作和玩耍。想看每个活动的占比及分布情况,可以考虑堆叠图
# 绘制堆叠图 :部分占总体的情况
days = [1,2,3,4,5]
sleeping = [7,8,6,11,7]
eating = [2,3,4,3,2]
working = [7,8,7,2,2]
playing = [8,5,7,8,13]
plt.figure(figsize=(8,6))
# days 时间轴,堆叠数据
plt.stackplot(days,sleeping,eating,working,playing,
             colors=['b','r','c','m'])
plt.title('堆叠图')
# 为堆叠图加上图例*****************
plt.plot([],[],color='b',label='sleeping',linewidth=5)
plt.plot([],[],color='r',label='eating',linewidth=5)
plt.plot([],[],color='c',label='working',linewidth=5)
plt.plot([],[],color='m',label='playing',linewidth=5)

plt.xlabel('x:星期')
plt.ylabel('y:花费时间')
plt.legend()
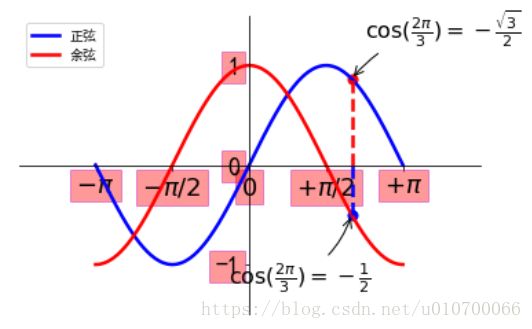
三、matplotlib进阶–综合应用
通过对三角函数的图形画法,掌握刻度,标示,点标注的基本使用
from matplotlib import pyplot as plt
import numpy as np
from numpy import pi as PI
plt.rcParams["font.sans-serif"] = ['SimHei']
plt.rcParams['axes.unicode_minus'] = False


# 从-pi 到pi平均取256个点
X = np.linspace(-np.pi,np.pi,256,endpoint=True)
# 根据X的值,求正弦和余弦函数
sin,cos = np.sin(X),np.cos(X)

# 绘制正弦
plt.plot(X,sin,'b-',label='正弦',lw=2.5) # 简写用法,'b-'  表示颜色为蓝,-代表折线图
plt.plot(X,cos,'r-',label='余弦',lw=2.5)

# 将x轴和y轴同时放大1.5倍
plt.xlim(X.min()*1.5,X.max()*1.5)
plt.ylim(cos.min()*1.5,cos.max()*1.5)


# 手动指定x轴和y轴的坐标刻度
plt.xticks([-PI,-PI/2,0,PI/2,PI])
plt.yticks([-1,0,1]) # Y轴3个坐标点

# 替换X轴中的数字,保持PI为π,用后面符号代替前面的数字
plt.xticks([-PI,-PI/2,0,PI/2,PI],[r'$-\pi$',r'$-\pi/2$',r'$0$',r'$+\pi/2$',r'$+\pi$',])# 第二个list里面的pi是matplotlib里面的跟numpy里面没有关系

# 隐藏和移动坐标轴
  # 1. 首先获取Axes对象
ax = plt.gca()   # 重点是这个,拿到了里面的刻度内容

    # 2.隐藏右边界和上边界
ax.spines['right'].set_color('none')
ax.spines['top'].set_color('none')

    # 3.设置坐标轴刻度显示位置
ax.xaxis.set_ticks_position('bottom')
ax.yaxis.set_ticks_position('left')
    # 4.先获取到下边界
ax.spines['bottom'].set_position(('data',0))
ax.spines['left'].set_position(('data',0))

# 根据两点绘制一条虚线
t=2*PI/3 # 先取一个数据点
plt.plot([t,t],[0,np.cos(t)], color ='blue', linewidth=2.5, linestyle="--")
plt.plot([t,t],[0,np.sin(t)], color ='red', linewidth=2.5, linestyle="--")

# 用绘制散点图方法在正弦和余弦上分别标注一个点 (t,sin(t)),(t,cos(t))
plt.scatter(t,np.cos(t),50,color='blue') # j简略写法,size=50
plt.scatter(t,np.sin(t),50,color='red')

##### 为这个特殊点添加标注
plt.annotate(r'$\cos(\frac{2\pi}{3})=-\frac{1}{2}$',
xy=(t, np.cos(t)), xycoords='data',
xytext=(-90, -50), textcoords='offset points', fontsize=16,
arrowprops=dict(arrowstyle="->", connectionstyle="arc3,rad=.2"))
plt.annotate(r'$\cos(\frac{2\pi}{3})=-\frac{\sqrt{3}}{2}$',
xy=(t, np.sin(t)), xycoords='data',
xytext=(10, 30), textcoords='offset points', fontsize=16,
arrowprops=dict(arrowstyle="->", connectionstyle="arc3,rad=.2"))

# # 设置x,y轴的刻度,并设置字体
for label in ax.get_xticklabels()+ax.get_yticklabels(): # 获取所有的刻度
    label.set_fontsize(18)  # 对每一个刻度设置字体
    label.set_bbox(dict(facecolor='r',edgecolor='m',alpha=0.4)) # 对每个刻度设置边框:facecolor:背景颜色,edgecolor边框颜色,alpha:透明度


#显示图例
plt.legend(loc='upper left')
plt.show()
四、matplotlib进阶-优化图形
1、优化柱状图
from matplotlib import pyplot as plt
import numpy as np
plt.rcParams["font.sans-serif"]=['SimHei']  # 用于正常显示中文标签
plt.rcParams['axes.unicode_minus']=False  # 用来正常显示负号


# 再论柱状图
# 创建一个画板
plt.figure(1)

# 为画板划分出多个Axes
ax = plt.subplot(111)# 111 代表用1行1列的第一个画板

# 数据准备
data = np.array([15,20,18,25]) # y轴数据
width = 0.5 # 柱状图宽度
x_bar = np.arange(4) # x轴数据

#绘制柱状图
rect = ax.bar(x_bar,data,width=width,color='lightblue')

# 在x,height 对应的坐标上添加文字:
for rec in rect:
    x = rec.get_x() # 获取x每个坐标刻度的值
    height = rec.get_height() # 获取每个柱状的高度
    ax.text(x+0.2,1.05*height,str(height)+'W')  # 在x,height 对应的坐标上添加文字:

# 设置x轴的刻度
ax.set_xticks(x_bar)
ax.set_xticklabels(['第一季度','第二季度','第三季度','第四季度'])

# 设置y轴的标注
ax.set_ylabel('销量(单位:万件)')
ax.set_xlabel('季度')

# 设置标题:
ax.set_title('2018年季度销售量统计')

# 是否显示网格
ax.grid(True)

# 拉伸Y轴,设置y轴位0--30
ax.set_ylim(0,30)
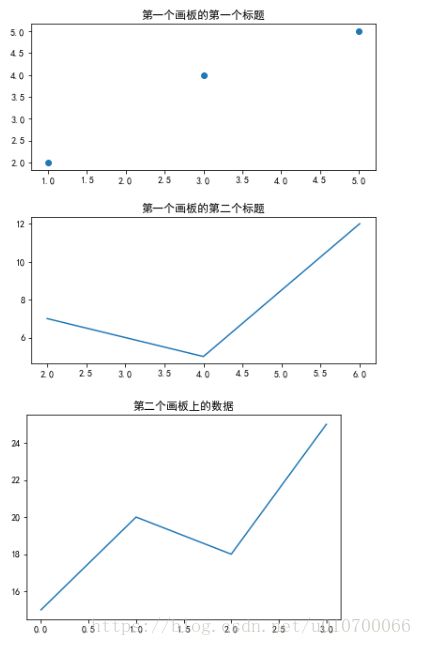
2、利用subplot绘制多幅图形
# 用subplot()方法绘制多个图
plt.figure(figsize=(6,6))
plt.figure(1) #开始画第一个画板
# 将第一个画板划分为有2行1列的组成的区块;所以这个画板有两个子区域,并获取到第一块区域
plt.subplot(211)
# 在第一子区域中绘图
plt.scatter([1,3,5],[2,4,5])

# 在第二个子区域
plt.subplot(212)
plt.plot([2,4,6],[7,5,12])

# 创建第二个画板
plt.figure(2)
y = np.array([15,20,18,25]) # y轴数据
x = np.arange(4) # x轴数据
# 在第二个画板上绘制柱状图
plt.plot(x,y)
# 为柱状图添加标题
plt.title('第二个画板上的数据')

# 从第二个画板切换到第一个画板
plt.figure(1)
# 再切换到第一个画板的第一个区域
plt.subplot(211)
# 为第一个画板的第一个图像加上标题
plt.title('第一个画板的第一个标题')
# 再切换到第一个画板的第二个区域
plt.subplot(212)
# 为第一个画板的第二个图像加上标题
plt.title('第一个画板的第二个标题')

# 设置画板中两个图片的间距
# 调整每隔子图之间的距离
plt.tight_layout(2)
五、matplotlib进阶–加载数据文件进行可视化
需要导入的必要包及其设置:
from matplotlib import pyplot as plt
import numpy as np
import pandas as pd
import csv
import json
import urllib
#用来正常显示中文标签
plt.rcParams['font.sans-serif']=['SimHei']
#用来正常显示负号
plt.rcParams['axes.unicode_minus']=False
1、直接根据数据绘制折线图
# 1、定义两个空列表,存放x和y轴数据
x,y = [],[]

with open('data/csv/matplotlib-demo.csv') as file:
    points = csv.reader(file,delimiter=',')
    for row in points:
        x.append(int(row[0]))
        y.append(int(row[1]))

#折线图
plt.plot(x,y,label='加载csv文件数据')
plt.xlabel('X轴')
plt.ylabel('Y轴')
plt.title('加载数据')
plt.legend()
2、用numpy加载csv数据
# unpack : True 拆分出一个两维数组
x,y =np.loadtxt('data/csv/matplotlib-demo.csv',delimiter=',',unpack=True)

plt.plot(x,y,label="numpy简化加载过程")
plt.xlabel('X轴')
plt.ylabel('y轴')
plt.title('加载csv文件数据')
plt.legend()
3、加载网络接口数据
url = 'https://api.douban.com/v2/book/1220562'
# 利用urllib加载接口数据
souce_data = urllib.request.urlopen(url).read().decode()
# 将字符串形式json数据转换成python字典
data = json.loads(souce_data)

# 获取字典中的keys值为tags下的数据
tags = data['tags']

# 遍历tags取x轴为name,y轴为count
x,y = [],[]
for tag in tags:
    x.append(tag['name'])
    y.append(tag['count'])
# 画图
plt.bar(x,y,label='热搜图书')
plt.legend()
plt.xlabel('热搜小说')
plt.ylabel('热搜排名')
plt.title('文学搜索排名')
六、matplotlib进阶–pandas简化数据可视化
需要导入的必要包及其设置:
from matplotlib import pyplot as plt
from pandas import DataFrame,Series
import numpy as np
import pandas as pd
import csv
import json
import urllib
#用来正常显示中文标签
plt.rcParams['font.sans-serif']=['SimHei']
#用来正常显示负号
plt.rcParams['axes.unicode_minus']=False
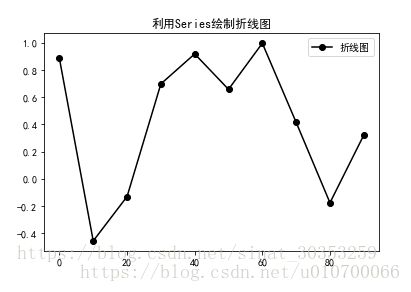
1、利用Series绘制折线图
# 利用随机函数创建一组随机序列
# cumsum累加求和
#指定索引
'''
用Series的绘图的原理
Series的索引作为x轴数据
Series的value值作为y轴数据
'''
index = np.arange(0,100,10)
series = Series(np.random.randn(10).cumsum(),index=index)
axes = series.plot(label='折线图',style='ko-')     # style='ko-' 带点
# axes = series.plot('bar',label='折线图')   可以加参数  bar
axes.set_title('利用Series绘制折线图')
axes.legend()
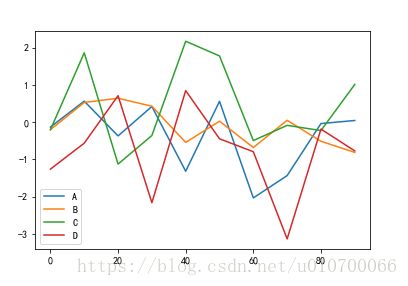
2、利用DtaFrame进行绘图
df = DataFrame(np.random.randn(10,4),
              index = np.arange(0,100,10),
              columns=list('ABCD'))

df.plot()
# 将DataFrame中各列的数据分配到不同的子图中
df.plot(subplots=True)3、绘制柱状图和条形图
#创建画板获取axes对象
fig,axes = plt.subplots(2,1,figsize=(10,10))
#调整画板大小
# fig.set_size_inches(30,10)
# 创建绘图数据
data = Series(np.random.randn(16),
             index = list('abcdefghijklmnop'))
# 利用series数据在2行1列的画板上的一块区域,绘制一个柱状图
data.plot(kind='bar',ax=axes[0],color='k',alpha=0.7)
# 利用series数据在2行1列的画板上的第二个区域,绘制一个柱状图
data.plot(kind='barh',ax=axes[1],color='r',alpha=0.7)
4、绘制直方图
# pandas 读取excel文件
df = pd.read_excel('data/excel/pandas-matplotlib.xlsx','Sheet1')

#绘制直方图
# 创建一个空白的画板
fig = plt.figure()
# 修改已创建画板的大小
fig.set_size_inches(10,8)
#在画板上添加一个Axes绘图区域
ax = fig.add_subplot(111)
# 在选中的绘图区域上绘制一个直方图
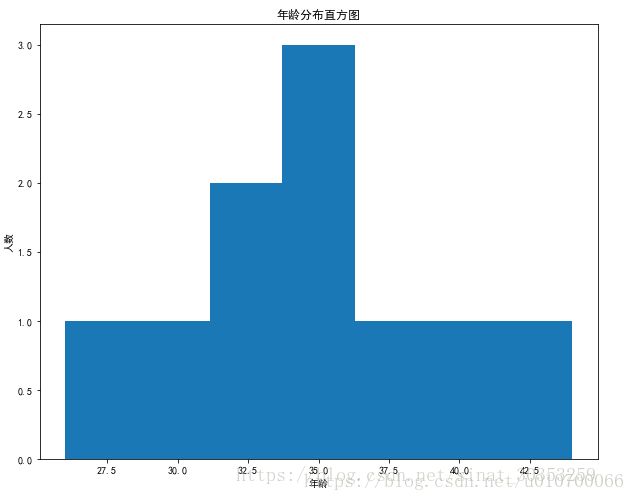
ax.hist(df.Age,bins=7)
plt.title('年龄分布直方图')
plt.xlabel('年龄')
plt.ylabel('人数')
5、绘制箱线图
# 绘制箱线图
fig = plt.figure()
# 创建绘图区域
ax = fig.add_subplot(111)
ax.boxplot(df.Age)
6、分组绘图
var = df.groupby('Gender').Sales.sum()
# 创建画板
fig =plt.figure()
# 添加绘图区域
ax = fig.add_subplot(111)
ax.set_title("标题")

# 根据分组后的数据
var.plot(kind='bar')
#根据BMI分组
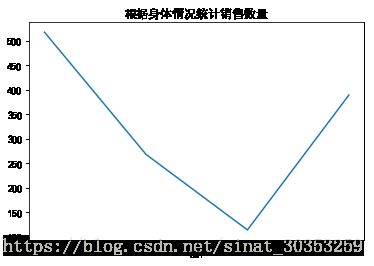
var = df.groupby('BMI').Sales.sum()
fig = plt.figure()
ax = fig.add_subplot(111)
ax.set_title('根据身体情况统计销售数量')
var.plot(kind='line')7、绘制堆积图
# 按照身体状况和性别进行分组后统计销售数量
var = df.groupby(['BMI','Gender']).Sales.sum()
result = var.unstack()
result

# 绘制堆积图
#stacked=True 堆积在一起
result.plot(kind='bar',stacked=True,color=(['b','g']))
8、绘制散点图
# 绘制散点图
fig = plt.figure()
ax = fig.add_subplot(111)
ax.scatter(df.Age,df.Sales)
9、绘制气泡图
# 绘制气泡图
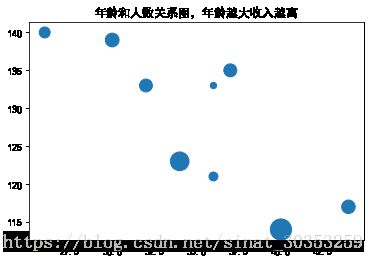
fig = plt.figure()

ax = fig.add_subplot(111)
ax.set_title('年龄和人数关系图,年龄越大收入越高')
ax.scatter(df.Age,df.Sales,s= df.Income)
9、绘制饼状图
# 绘制饼图
#stack() 把列索引转换成行索引
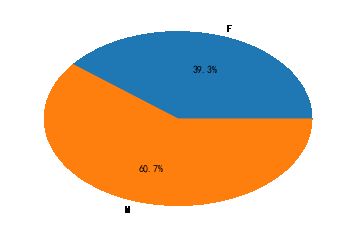
var = df.groupby(df.Gender).sum()
# 取x坐标
x_list = var.Sales
label_list = var.index
# 是否直方显示
# plt.axis('equal')
plt.pie(x_list,labels=label_list,autopct='%1.1f%%')
七、绘图利器PyEcharts
前导安装
pip install pyechartsfrom pyecharts import Bar
from pyecharts import Line1、绘制柱状图
# 画简单的柱状图
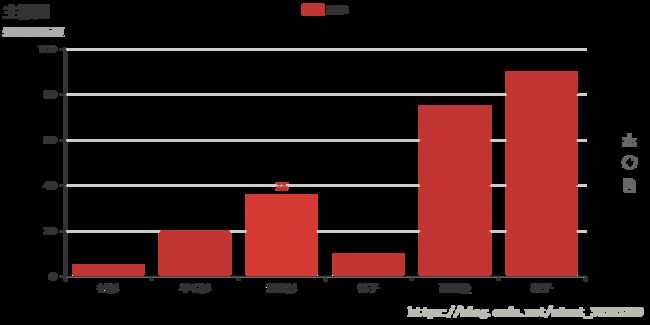
bar = Bar("主标题", "这里是副标题")
# pyecharts 遵循所有图表都先定义数据在进行展示
bar.add("服装", ["衬衫", "羊毛衫", "雪纺衫","裤子", "高跟鞋", "袜子"],
        [5, 20, 36, 10, 75, 90])

#方法一: 将图表渲染输出到html页面
# bar.render()    # 如果不穿参数,默认保存到当前文件夹下

# 方法二: 直接再jupyter中展示
bar
2、根据柱状图绘制堆积图
# 2、根据柱状图绘制堆积图
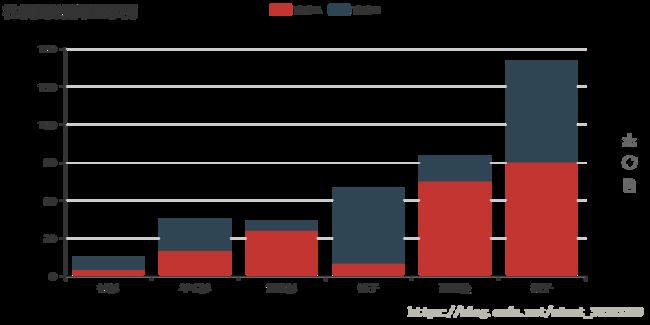
attr = ["衬衫", "羊毛衫", "雪纺衫", "裤子", "高跟鞋", "袜子"]
v1 = [5, 20, 36, 10, 75, 90]
v2 = [10, 25, 8, 60, 20, 80]
# 添加标题
bar = Bar("柱状图数据堆叠示例")
bar.add('商家A',attr,v1,is_stack=True)
bar.add('商家B',attr,v2,is_stack=True)
bar
# 为柱状图添加标注点或者标注线
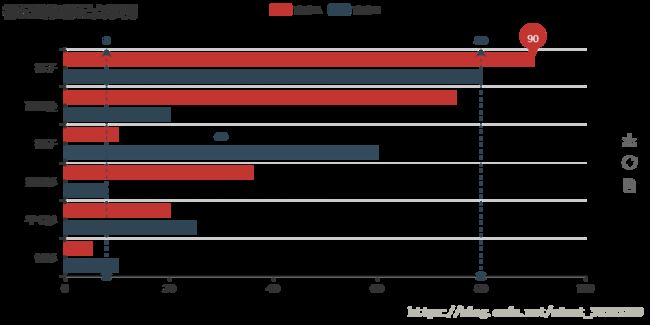
attr = ["衬衫", "羊毛衫", "雪纺衫", "裤子", "高跟鞋","袜子"]
v1 = [5, 20, 36, 10, 75, 90]
v2 = [10, 25, 8, 60, 20, 80]
bar = Bar("标记线和标记点示例")
# 为柱状图添加标记点
bar.add("商家A", attr, v1, mark_point=["max"]) #mark_point=["max"] 标注出最大点
# 为柱状图添加标注线
bar.add("商家B", attr, v2, mark_line=["min", "max"],is_convert=True) #is_convert=True 行和列转换
bar3、绘制折线图
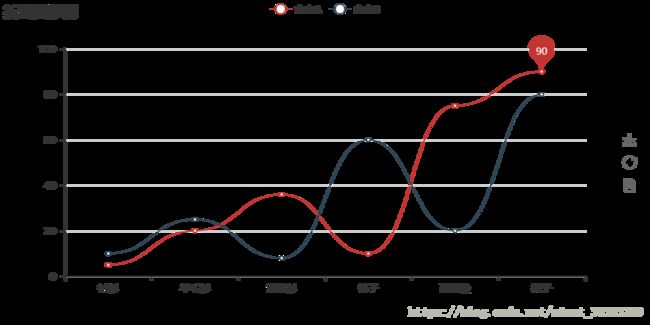
attr = ["衬衫", "羊毛衫", "雪纺衫", "裤子", "高跟鞋","袜子"]
v1 = [5, 20, 36, 10, 75, 90]
v2 = [10, 25, 8, 60, 20, 80]

myLine  =Line('折线图示例')
# is_smooth 点之间是否进行平滑曲线连接
myLine.add('商家A',attr,v1,mark_point=['max'],is_smooth=True)
myLine.add('商家B',attr,v2,is_smooth=True)
myLine
4、折线图修改标注点的形状和标注文字的字体颜色
attr = ["衬衫", "羊毛衫", "雪纺衫", "裤子", "高跟鞋","袜子"]
v1 = [5, 20, 36, 10, 75, 90]
v2 = [10, 25, 8, 60, 20, 80]
markline = Line('添加标注点的折线图')
markline.add('商家A',attr,v1,
            mark_point=['min','average','max'],
            mark_point_symbol='diamond',
            mark_point_textcolor='#40ff27')
markline.add('商家B',attr,v2,
             mark_point=['min','average','max'],
             mark_point_symbol='arrow',
            mark_point_symbolsize=20)
'''
mark_point 标注点
mark_point_symbol 标注点的形状
mark_point_symbolsize  标注点的大小
mark_point_textcolor   标注点的字体颜色
'''
markline
5、折线图–面积图示例
# 5、折线图--面积图示例
attr = ["衬衫", "羊毛衫", "雪纺衫", "裤子", "高跟鞋","袜子"]
v1 = [5, 20, 36, 10, 75, 90]
v2 = [10, 25, 8, 60, 20, 80]

arealine = Line('面积图示例')
arealine.add('商家A',attr,v1,
             is_fill=True,
            area_color='#00ff00',
            line_opacity=1,
             area_opacity=0.4,
             symbol= None,
            )
arealine.add('商家B',attr,v2,
             is_fill=True,
            area_color='#000',
            area_opacity=0.3,
             is_smooth=True)
'''
is_fill 为折线图所包裹的区域填充颜色
area_color   填充区域的颜色
area_opacity  填充区域的透明度
line_opacity=0.2 线条的不透明度
'''
arealine
6、画饼图
#6、画饼图
from pyecharts import Pie
attr = ["衬衫", "羊毛衫", "雪纺衫", "裤子", "高跟鞋","袜子"]
v1 = [5, 20, 36, 10, 75, 90]
v2 = [10, 25, 8, 60, 20, 80]
pie = Pie('饼图')
pie.add('',attr,v1,is_label_show=True)
pie
# 饼图圆环
attr = ["衬衫", "羊毛衫", "雪纺衫", "裤子", "高跟鞋", "袜子"]
v1 = [11, 12, 13, 10, 10, 10]
pie = Pie("饼图-圆环图示例",title_pos='center')
pie.add("", attr, v1, radius=[40, 75],
label_text_color=None,
is_label_show=True,
legend_orient='vertical', #legend_orient 图例展开的方向
legend_pos='left') # 图例的位置
pie
7、散点图
v1 = [10, 20, 30, 40, 50, 60]
v2 = [10, 20, 30, 40, 50, 60]
scatter = Scatter("散点图示例")
scatter.add("A", v1, v2)
scatter.add("B", v1[::-1], v2)
scatter
v1 = [10, 20, 30, 40, 50, 60]
v2 = [10, 20, 30, 40, 50, 60]
scatter = Scatter("散点图示例")
scatter.add("A", v1, v2)
scatter.add("B", v1[::-1], v2, is_visualmap=True,
visual_type='size',
visual_range_size=[20, 80])
scatter8、绘制地图
from pyecharts import Map
value = [155, 10, 66, 78,200,30]
attr = ["广东", "山东", "北京", "上海","安徽", "新疆"]
map = Map("全国地图示例", width=1200,
height=600)
map.add("", attr, value, maptype='china')
map
注意:如果以上不显示地图,则要安装第三方库
pip install echarts-countries-pypkg
pip install echarts-china-provinces-pypkg
pip install echarts-china-cities-pypkg
pip install echarts-china-counties-pypkg
pip install echarts-china-misc-pypkg
pip install echarts-united-kingdom-pypkg
from pyecharts import Map
value = [20, 190, 253, 77, 65]
attr = ['汕头市', '汕尾市', '揭阳市', '阳江市', '肇庆市']
map = Map("广东地图示例", width=1200,
height=600)
map.add("", attr, value, maptype='广东',
is_visualmap=True,
visual_text_color='#000',is_label_show=True)
map9、绘制词云
from pyecharts import WordCloud
name = ['阿里云故障', '韩国对阵德国', '杨敬农获刑', '朱婷36分创纪录','德国队出局','暴雨毕业照走红',
 '孙兴慜假摔', '内马尔助攻席尔瓦', '世界杯','结婚率逐年走低', '巴西2-0塞尔维亚','孟加拉外长访华',
 '凯塔加盟利物浦', '瑞典3-0墨西哥', '巴西设中国移民日', '直播手抓眼镜蛇','韩国2-0德国',
 '厄齐尔首发', '墨西哥对阵瑞典','骑电动车坠渠溺亡']
value = [
428623, 367294, 356497, 351699, 350049, 348700, 348100, 347200, 345701,
341652, 330256, 329956, 306114, 260829, 229340, 166961, 158863, 148517, 145218, 144918]
wordcloud = WordCloud('绘制词云',width=1300, height=620)
wordcloud.add("", name, value, word_size_range=[20, 100])
wordcloud


