prometheus(version 2.0.0)系列之三
本文将结合配置和web界面对prometheus的基本使用做示例解说
首先来看一下初始配置
prometheus.yml
# my global config
global:
scrape_interval: 15s # Set the scrape interval to every 15 seconds. Default is every 1 minute.
evaluation_interval: 15s # Evaluate rules every 15 seconds. The default is every 1 minute.
# scrape_timeout is set to the global default (10s).
# Alertmanager configuration
alerting:
alertmanagers:
- static_configs:
- targets:
- localhost:9093
# Load rules once and periodically evaluate them according to the global 'evaluation_interval'.
rule_files:
- "/etc/prometheus/rules/*.yml"
# - "second_rules.yml"
# A scrape configuration containing exactly one endpoint to scrape:
# Here it's Prometheus itself.
scrape_configs:
# The job name is added as a label `job=` to any timeseries scraped from this config.
- job_name: ' prometheus'
# metrics_path defaults to '/metrics'
# scheme defaults to 'http'.
static_configs:
- targets: ['localhost:9090']
在prometheus的基本配置中我们指定了Alertmanager为本地的Alertmanager;并且添加了一个服务,服务的端点只有一个,即prometheus自己;指定的报警规则读取路径为/etc/prometheus/rules/*.yml,稍后我们将会向这个路径中添加规则
alertmanager.yml
global:
  # The smarthost and SMTP sender used for mail notifications.
  smtp_smarthost: 'localhost:25'
  smtp_from: '[email protected]'
  smtp_auth_username: 'alertmanager'
  smtp_auth_password: 'password'
  # The auth token for Hipchat.

# The directory from which notification templates are read.
templates:
- '/etc/alertmanager/template/*.tmpl'

# The root route on which each incoming alert enters.
route:
  # The labels by which incoming alerts are grouped together. For example,
  # multiple alerts coming in for cluster=A and alertname=LatencyHigh would
  # be batched into a single group.
  group_by: ['alertname', 'cluster', 'service']

  # When a new group of alerts is created by an incoming alert, wait at
  # least 'group_wait' to send the initial notification.
  # This way ensures that you get multiple alerts for the same group that start
  # firing shortly after another are batched together on the first
  # notification.
  group_wait: 30s

  # When the first notification was sent, wait 'group_interval' to send a batch
  # of new alerts that started firing for that group.
  group_interval: 5m

  # If an alert has successfully been sent, wait 'repeat_interval' to
  # resend them.
  repeat_interval: 3h

  # A default receiver
  receiver: webhook

  # All the above attributes are inherited by all child routes and can
  # overwritten on each.

  # The child route trees.
  routes:

# Inhibition rules allow to mute a set of alerts given that another alert is
# firing.
# We use this to mute any warning-level notifications if the same alert is
# already critical.
inhibit_rules:
- source_match:
    severity: 'critical'
  target_match:
    severity: 'warning'
  # Apply inhibition if the alertname is the same.
  equal: ['alertname', 'cluster', 'service']


receivers:
- name: 'webhook'
  webhook_configs:
  - url: 'http://127.0.0.1:8090/alert_webhook'
alertmanager的配置中我们只需要注意两处,即全局配置的接收者webhook以及路由部分指定的唯一接受者为webhook,等会我们将使用一个微服务来示例如何通过webhook接受报警信息
接着我们结合内置的web界面修改配置来看一下效果
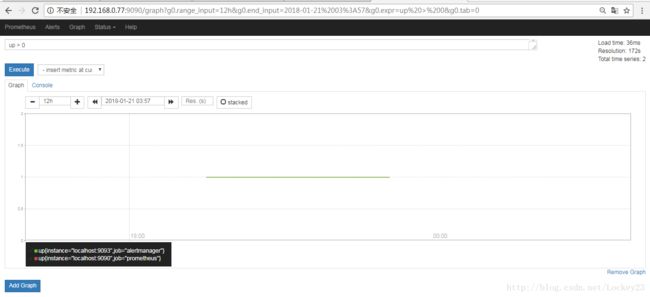
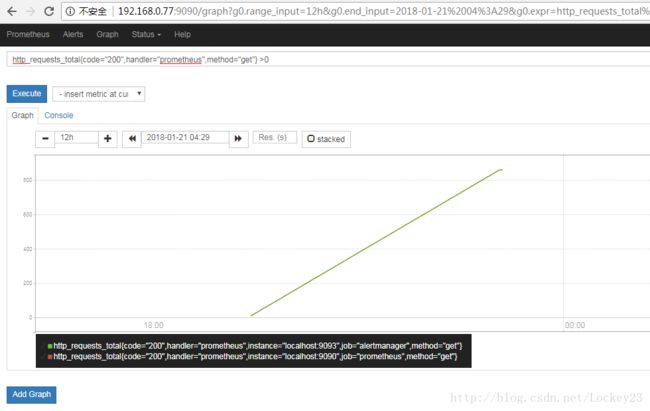
在graph导航中我们输入查询语句然后选择需要展示的时间段就有了下面的展示结果
然后我们在status->targets导航中查看当前的targets状态,因为基本配置中只有一个并且属于在线状态所以就会有一下展示:
然后我们虚构一个端点信息,在基本配置的targets列表中添加一项:

然后使服务重新加载配置:
curl -XPOST http://192.168.0.77:9090/-/reload
刷新targets对应的界面可以看到如下展示(以下为隔了几秒刷新出现的两个状态展示)
因为端点'localhost:9100'当前不存在所以状态最终为'DOWN'
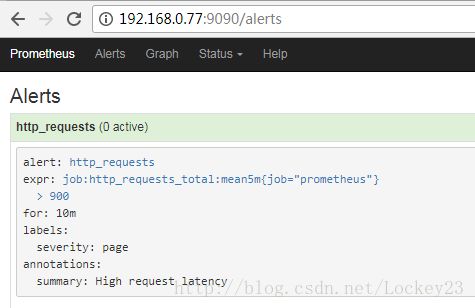
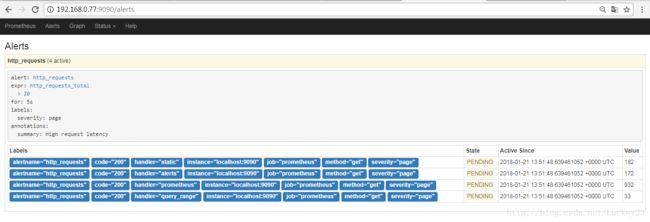
接下来我们上一个规则看一下效果
要配置规则就必须要对应一定的指标,想知道有哪些指标可以访问以下链接所指:
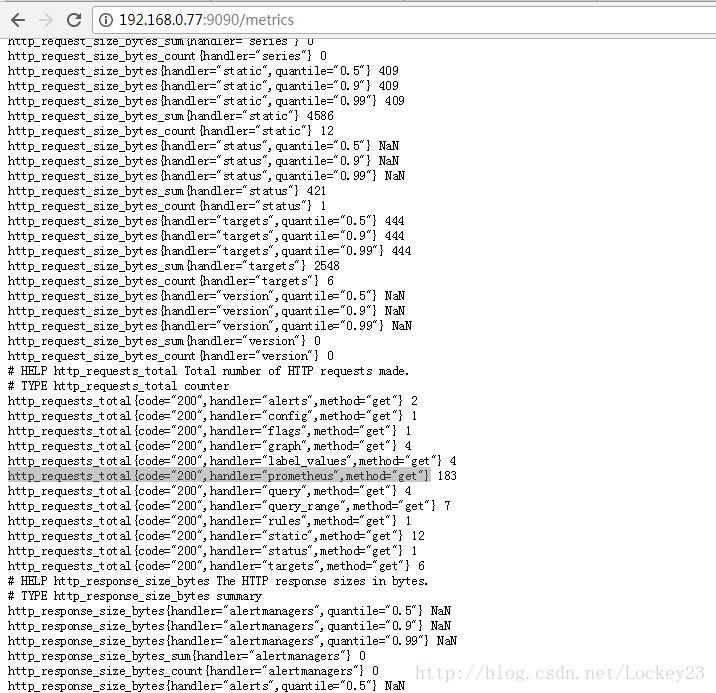
然后我们来写规则,然后校验规则:
[root@vm7-1201-pure rules]# promtool check rules http_requests_total.yml
Checking http_requests_total.yml
  SUCCESS: 1 rules found

[root@vm7-1201-pure rules]# cat http_requests_total.yml
groups:
- name: http_requests_total
  rules:
  - alert: http_requests
    expr: job:http_requests_total:mean5m{job="prometheus"} > 900
    for: 10m
    labels:
      severity: page
    annotations:
      summary: High request latency
然后我们重新加载一下:
curl -XPOST http://127.0.0.1:9090/-/reload
