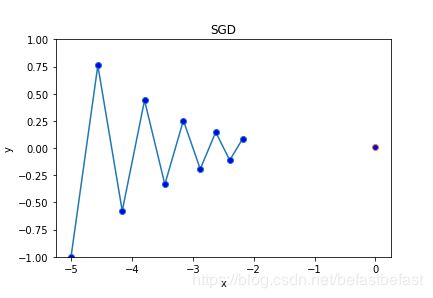
AdaGrad 与 SGD的比较
optimizer=SGD(0.88)
optimizer=AdaGrad(0.88)
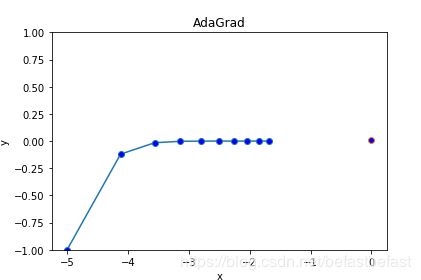
可以看出,用AdaGrad方法,使得学习路径比较平缓,更快速地到达梯度最小点
# -*- coding: utf-8 -*-
"""
Created on Tue Jun 25 09:04:14 2019
@author: Administrator
"""
import sys, os
sys.path.append(os.pardir)
import numpy as np
from common.gradient import numerical_gradient
import matplotlib.pylab as plt
class simple:
def __init__(self,x,y):
self.x=x
self.y=y
def f(self):
z=np.sum((self.x**2)/20+self.y**2)###### sum!!
#or ValueError: setting an array element with a sequence.
return z
def grad(self):
grads={}
self.f()
Func=lambda W:self.f()
grads['x']=numerical_gradient(Func,self.x)
grads['y']=numerical_gradient(Func,self.y)
return grads
class SGD:
def __init__(self,lr=0.01):
self.lr=lr
def update(self,params,grads):
for key in params.keys():
params[key]-=self.lr*grads[key]
class AdaGrad:
def __init__(self,lr=0.01):
self.lr=lr
self.h=None
def update(self,params,grads):
if self.h is None:
self.h={}
for key,value in params.items():
self.h[key]=np.zeros_like(value)
for key in params.keys():
self.h[key] += grads[key]**2
params[key]-=self.lr*(1/np.sqrt(self.h[key])+1e-7)*grads[key]
print(self.lr*(1/np.sqrt(self.h[key])+1e-7))
params={}
#params['x']=np.arange(-0.1,0,0.1)
params['x']=np.array([-5.0])
print(params['x'])
#params['y']=np.arange(-0.1,0,0.1)
params['y']=np.array([-1.0])
Net=simple(params['x'],params['y'])
#optimizer=SGD(0.88)#0.8
optimizer=AdaGrad(0.88)#0.8
opt_num =10
result_x=np.arange(opt_num,dtype=np.float)
result_y=np.arange(opt_num,dtype=np.float)
for i in range(opt_num):
grads=Net.grad()
result_x[i]=params['x'][0]
result_y[i]=params['y'][0]
optimizer.update(params,grads)
print(result_x)
plt.plot(result_x,result_y,0.01,markerfacecolor='blue',marker='o')
plt.ylim(-1,1)
plt.xlabel("x")
plt.ylabel("y")
#plt.title("SGD")
plt.title("AdaGrad")
plt.show()