CentOS7搭建ELK-6.2.3版本
ELK是ElasticSerach、Logstash、Kibana三款产品名称的首字母集合,用于日志的搜集和搜索,今天我们一起搭建和体验基于ELK的日志服务;
环境规划
本次实战需要两台电脑(或者vmware下的两个虚拟机),操作系统都是CentOS7,它们的身份、配置、地址等信息如下:
| hostname | IP地址 | 身份 | 配置 |
|---|---|---|---|
| elk-server | 192.168.119.132 | ELK服务端,接收日志,提供日志搜索服务 | 双核,4G内存 |
| nginx-server | 192.168.119.133 | Nginx服务端,产生的访问日志通过上报到Logstash | 双核,2G内存 |
部署情况简介
运行时的部署情况如下图所示:
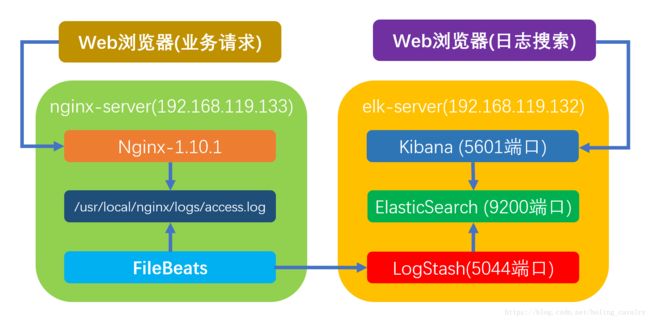
- 业务请求到达nginx-server机器上的Nginx;
- Nginx响应请求,并在access.log文件中增加访问记录;
- FileBeat搜集新增的日志,通过LogStash的5044端口上传日志;
- LogStash将日志信息通过本机的9200端口传入到ElasticSerach;
- 搜索日志的用户通过浏览器访问Kibana,服务器端口是5601;
- Kibana通过9200端口访问ElasticSerach;
关于Nginx安装
请在nginx-server机器上安装nginx1.10.1或者更高版本,安装的详细步骤请参考《 CentOS7安装Nginx1.10.1》;
接下来安装ELK吧;
安装JDK
首先请在elk-server机器上JDK8;
在ELK官方文档中(https://www.elastic.co/guide/en/elasticsearch/hadoop/6.2/requirements.html),推荐的JDK版本为8,如下图所示:

在CentOS7安装JDK8的步骤请参考《CentOS7安装JDK8》;
创建用户
ElasticSerach要求以非root身份启动,所以我们要创建一个用户:
- 创建用户组:groupadd elasticsearch;
- 创建用户加入用户组:useradd elasticsearch -g elasticsearch;
- 设置ElasticSerach文件夹为用户elasticsearch所有:chown -R elasticsearch.elasticsearch /usr/local/work/elasticsearch-6.2.3;
系统设置
- 设置hostname,打开文件/etc/hostname,将内容改为elk-server
- 关闭防火墙(如果因为其他原因不能关闭防火墙,也请不要禁止80端口):systemctl stop firewalld.service
- 禁止防火墙自动启动:systemctl disable firewalld.service
- 打开文件/etc/security/limits.conf,添加下面四行内容:
* soft nofile 65536
* hard nofile 131072
* soft nproc 2048
* hard nproc 4096
5. 打开文件 /etc/sysctl.conf,添加下面一行内容: ```shell vm.max_map_count=655360 ```
6. 加载sysctl配置,执行命令: sysctl -p 7. 重启电脑;
elk-server:安装文件准备
请在ELK官网https://www.elastic.co/downloads下载以下文件:
- elasticsearch-6.2.3.tar.gz;
- logstash-6.2.3.tar.gz;
- kibana-6.2.3-linux-x86_64.tar.gz;
上述三个文件,推荐在CentOS7的命令行输入以下四个命令下载:
wget https://artifacts.elastic.co/downloads/elasticsearch/elasticsearch-6.2.3.tar.gz
wget https://artifacts.elastic.co/downloads/logstash/logstash-6.2.3.tar.gz
wget https://artifacts.elastic.co/downloads/kibana/kibana-6.2.3-linux-x86_64.tar.gz
下载完毕后,创建目录/usr/local/work,将刚刚下载的三个文件全部在这个目录下解压,得到以下三个文件夹:
- /usr/local/work/elasticsearch-6.2.3
- /usr/local/work/logstash-6.2.3
- kibana-6.2.3-linux-x86_64
启动ElasticSerach
- 切换到用户elasticsearch:su elasticsearch;
- 进入目录/usr/local/work/elasticsearch-6.2.3;
- 执行启动命令:bin/elasticsearch -d,此时会在后台启动elasticsearch;
- 查看启动日志可执行命令:tail -f /usr/local/work/elasticsearch-6.2.3/logs/elasticsearch.log,大约五到十分钟后启动成功,提示如下:
[2018-04-07T10:12:27,392][INFO ][o.e.n.Node               ] initialized
[2018-04-07T10:12:27,392][INFO ][o.e.n.Node               ] [MNb1nGq] starting ...
[2018-04-07T10:12:39,676][INFO ][o.e.t.TransportService   ] [MNb1nGq] publish_address {127.0.0.1:9300}, bound_addresses {[::1]:9300}, {127.0.0.1:9300}
[2018-04-07T10:12:42,772][INFO ][o.e.c.s.MasterService    ] [MNb1nGq] zen-disco-elected-as-master ([0] nodes joined), reason: new_master {MNb1nGq}{MNb1nGq6Tn6VskdKFQckow}{_DglQhgmRsGAF2D7eTfVfg}{127.0.0.1}{127.0.0.1:9300}
[2018-04-07T10:12:42,776][INFO ][o.e.c.s.ClusterApplierService] [MNb1nGq] new_master {MNb1nGq}{MNb1nGq6Tn6VskdKFQckow}{_DglQhgmRsGAF2D7eTfVfg}{127.0.0.1}{127.0.0.1:9300}, reason: apply cluster state (from master [master {MNb1nGq}{MNb1nGq6Tn6VskdKFQckow}{_DglQhgmRsGAF2D7eTfVfg}{127.0.0.1}{127.0.0.1:9300} committed version [1] source [zen-disco-elected-as-master ([0] nodes joined)]])
[2018-04-07T10:12:42,817][INFO ][o.e.g.GatewayService     ] [MNb1nGq] recovered [0] indices into cluster_state
[2018-04-07T10:12:42,821][INFO ][o.e.h.n.Netty4HttpServerTransport] [MNb1nGq] publish_address {127.0.0.1:9200}, bound_addresses {[::1]:9200}, {127.0.0.1:9200}
[2018-04-07T10:12:42,821][INFO ][o.e.n.Node               ] [MNb1nGq] starte
5. 执行curl命令检查服务是否正常响应: curl 127.0.0.1:9200,收到响应如下: ```shell [elasticsearch@elk-server work]$ curl 127.0.0.1:9200 { "name" : "MNb1nGq", "cluster_name" : "elasticsearch", "cluster_uuid" : "ZHkI7PCQTnCqMBM6rhyT5g", "version" : { "number" : "6.2.3", "build_hash" : "c59ff00", "build_date" : "2018-03-13T10:06:29.741383Z", "build_snapshot" : false, "lucene_version" : "7.2.1", "minimum_wire_compatibility_version" : "5.6.0", "minimum_index_compatibility_version" : "5.0.0" }, "tagline" : "You Know, for Search" } ``` 至此,ElasticSerach服务启动成功,接下来是Logstash;
配置和启动Logstash
- 在目录/usr/local/work/logstash-6.2.3下创建文件default.conf,内容如下:
# 监听5044端口作为输入
input {
	beats {
		port => "5044"
    }
}
# 数据过滤
filter {
    grok {
	    match => { "message" => "%{COMBINEDAPACHELOG}" }
    }
    geoip {
		source => "clientip"
    }
}
# 输出配置为本机的9200端口,这是ElasticSerach服务的监听端口
output {
    elasticsearch {
	    hosts => ["127.0.0.1:9200"]
    }
}
2. 后台启动Logstash服务: nohup bin/logstash -f default.conf --config.reload.automatic & 3. 查看启动日志: tail -f logs/logstash-plain.log,启动成功的信息如下: ```shell [2018-04-07T10:56:28,143][INFO ][logstash.runner ] Starting Logstash {"logstash.version"=>"6.2.3"} [2018-04-07T10:56:28,870][INFO ][logstash.agent ] Successfully started Logstash API endpoint {:port=>9600} [2018-04-07T10:56:33,639][INFO ][logstash.pipeline ] Starting pipeline {:pipeline_id=>"main", "pipeline.workers"=>1, "pipeline.batch.size"=>125, "pipeline.batch.delay"=>50} [2018-04-07T10:56:34,628][INFO ][logstash.outputs.elasticsearch] Elasticsearch pool URLs updated {:changes=>{:removed=>[], :added=>[http://127.0.0.1:9200/]}} [2018-04-07T10:56:34,650][INFO ][logstash.outputs.elasticsearch] Running health check to see if an Elasticsearch connection is working {:healthcheck_url=>http://127.0.0.1:9200/, :path=>"/"} [2018-04-07T10:56:35,147][WARN ][logstash.outputs.elasticsearch] Restored connection to ES instance {:url=>"http://127.0.0.1:9200/"} [2018-04-07T10:56:35,245][INFO ][logstash.outputs.elasticsearch] ES Output version determined {:es_version=>6} [2018-04-07T10:56:35,248][WARN ][logstash.outputs.elasticsearch] Detected a 6.x and above cluster: the `type` event field won't be used to determine the document _type {:es_version=>6} [2018-04-07T10:56:35,304][INFO ][logstash.outputs.elasticsearch] Using mapping template from {:path=>nil} [2018-04-07T10:56:35,333][INFO ][logstash.outputs.elasticsearch] Attempting to install template {:manage_template=>{"template"=>"logstash-*", "version"=>60001, "settings"=>{"index.refresh_interval"=>"5s"}, "mappings"=>{"_default_"=>{"dynamic_templates"=>[{"message_field"=>{"path_match"=>"message", "match_mapping_type"=>"string", "mapping"=>{"type"=>"text", "norms"=>false}}}, {"string_fields"=>{"match"=>"*", "match_mapping_type"=>"string", "mapping"=>{"type"=>"text", "norms"=>false, "fields"=>{"keyword"=>{"type"=>"keyword", "ignore_above"=>256}}}}}], "properties"=>{"@timestamp"=>{"type"=>"date"}, "@version"=>{"type"=>"keyword"}, "geoip"=>{"dynamic"=>true, "properties"=>{"ip"=>{"type"=>"ip"}, "location"=>{"type"=>"geo_point"}, "latitude"=>{"type"=>"half_float"}, "longitude"=>{"type"=>"half_float"}}}}}}}} [2018-04-07T10:56:35,415][INFO ][logstash.outputs.elasticsearch] New Elasticsearch output {:class=>"LogStash::Outputs::ElasticSearch", :hosts=>["//127.0.0.1:9200"]} [2018-04-07T10:56:35,786][INFO ][logstash.filters.geoip ] Using geoip database {:path=>"/usr/local/work/logstash-6.2.3/vendor/bundle/jruby/2.3.0/gems/logstash-filter-geoip-5.0.3-java/vendor/GeoLite2-City.mmdb"} [2018-04-07T10:56:36,727][INFO ][logstash.inputs.beats ] Beats inputs: Starting input listener {:address=>"0.0.0.0:5044"} [2018-04-07T10:56:36,902][INFO ][logstash.pipeline ] Pipeline started succesfully {:pipeline_id=>"main", :thread=>"#"} [2018-04-07T10:56:36,967][INFO ][org.logstash.beats.Server] Starting server on port: 5044 [2018-04-07T10:56:37,083][INFO ][logstash.agent ] Pipelines running {:count=>1, :pipelines=>["main"]} ```
Kibana
- 打开Kibana的配置文件/usr/local/work/kibana-6.2.3-linux-x86_64/config/kibana.yml,找到下面这行:
#server.host: "localhost"
改成如下内容:
server.host: "192.168.119.132"
这样其他电脑就能用浏览器访问Kibana的服务了;
2. 进入Kibana的目录:/usr/local/work/kibana-6.2.3-linux-x86_64
3. 执行启动命令:nohup bin/kibana &
4. 查看启动日志:tail -f nohup.out
5. 以下信息表示启动成功:
{"type":"log","@timestamp":"2018-04-07T04:44:59Z","tags":["status","plugin:elasticsearch@6.2.3","info"],"pid":3206,"state":"yellow","message":"Status changed from uninitialized to yellow - Waiting for Elasticsearch","prevState":"uninitialized","prevMsg":"uninitialized"}
{"type":"log","@timestamp":"2018-04-07T04:44:59Z","tags":["status","plugin:console@6.2.3","info"],"pid":3206,"state":"green","message":"Status changed from uninitialized to green - Ready","prevState":"uninitialized","prevMsg":"uninitialized"}
{"type":"log","@timestamp":"2018-04-07T04:45:01Z","tags":["status","plugin:timelion@6.2.3","info"],"pid":3206,"state":"green","message":"Status changed from uninitialized to green - Ready","prevState":"uninitialized","prevMsg":"uninitialized"}
{"type":"log","@timestamp":"2018-04-07T04:45:01Z","tags":["status","plugin:metrics@6.2.3","info"],"pid":3206,"state":"green","message":"Status changed from uninitialized to green - Ready","prevState":"uninitialized","prevMsg":"uninitialized"}
{"type":"log","@timestamp":"2018-04-07T04:45:01Z","tags":["listening","info"],"pid":3206,"message":"Server running at http://localhost:5601"}
{"type":"log","@timestamp":"2018-04-07T04:45:01Z","tags":["status","plugin:elasticsearch@6.2.3","info"],"pid":3206,"state":"green","message":"Status changed from yellow to green - Ready","prevState":"yellow","prevMsg":"Waiting for Elasticsearch"}
6. 在浏览器访问http://192.168.119.132:5601,看到如下页面: 
至此,ELK服务启动成功,接下来我们将业务日志上报上来,需要操作另一台电脑:nginx-server;
防火墙
首先,请关闭nginx-server的防火墙:
systemctl stop firewalld.service && systemctl disable firewalld.service
安装Nginx
在nginx-server上安装并启动nginx服务,可以参考《 CentOS7安装Nginx1.10.1》;
FileBeat
- 在nginx-server电脑创建目录/usr/local/work
- 在/usr/local/work目录下执行以下命令,下载FileBeat安装包:
wget https://artifacts.elastic.co/downloads/beats/filebeat/filebeat-6.2.3-linux-x86_64.tar.gz**重点内容**
3. 解压: tar -zxvf filebeat-6.2.3-linux-x86_64.tar.gz 4. 打开文件 /usr/local/work/filebeat-6.2.3-linux-x86_64/filebeat.yml,找到如下图的位置: 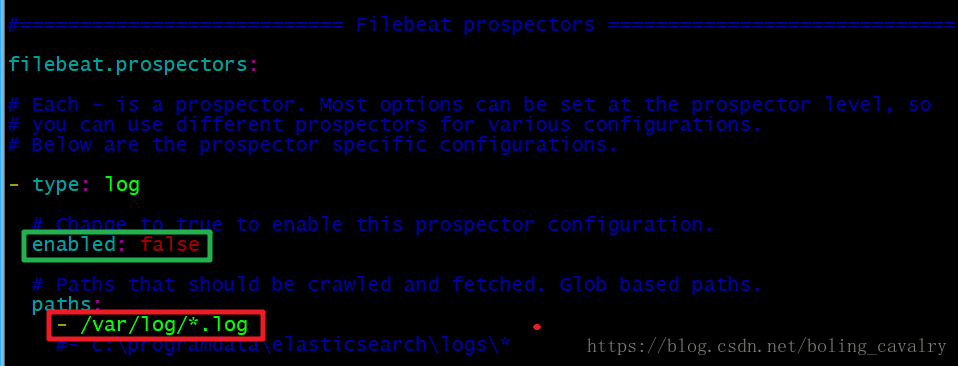 5. 首先,将上图绿框中的 enabled: false改为 enabled: true; 6. 其次,将上图红框中的 - /var/log/*.log改为 - /usr/local/nginx/logs/\*.log; 7. 继续修改filebeat.yml文件,找到下图两个红框中的内容,在每行的左侧添加"#",将这两行内容注释掉: 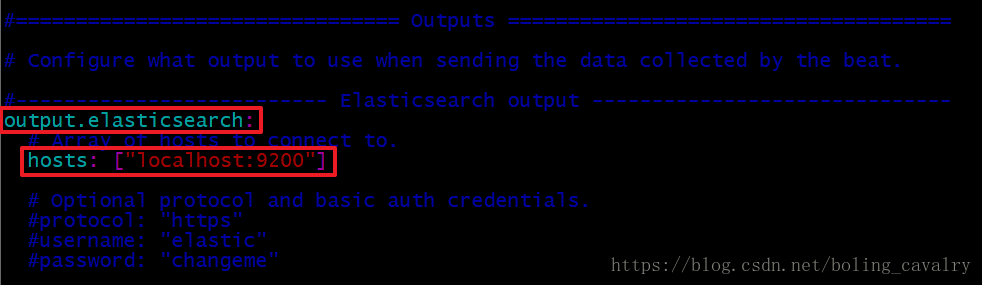
8. 继续修改filebeat.yml文件,找到下图中的内容: 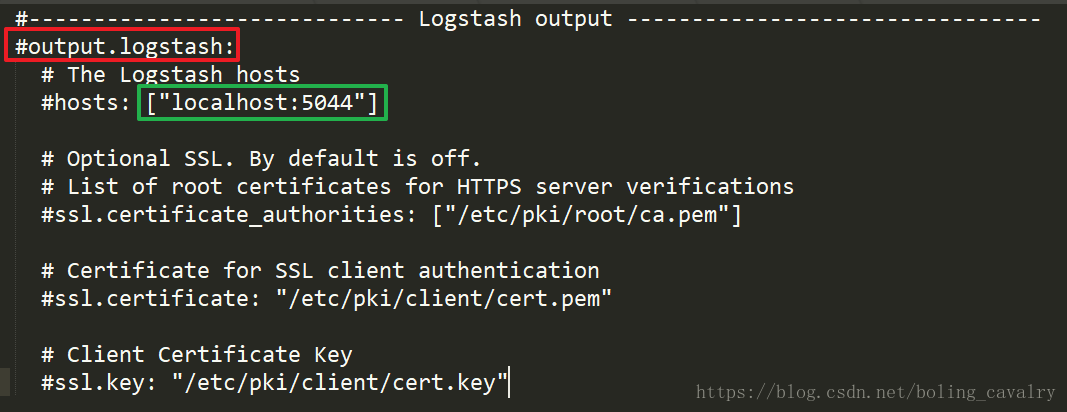 首先,将上图红框中的"#"去掉; 其次,将上图绿框那一行的左侧"#"去掉; 最后,将上图绿框中的内容从 ["localhost:9200"]改为 ["192.168.119.132:9200"](连接ElasticSerach); 改好的内容如下图; 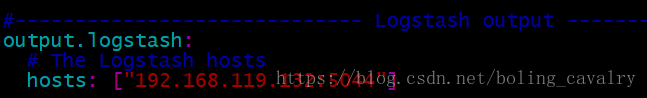
9. 启动FileBeat: ./filebeat -e -c filebeat.yml -d "publish"
至此,FileBeat也启动成功了,接下来验证服务;
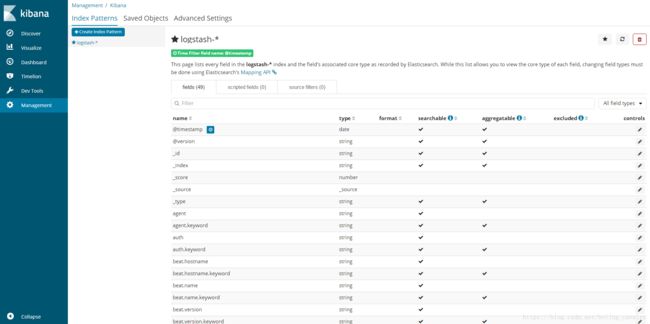
创建Index Patterns
- 通过浏览器多访问几次nginx服务,这样能多制造一些访问日志,访问地址:http://192.168.119.133
- 访问Kibana:http://192.168.119.132:5601,点击左上角的Discover,如下图红框,可以看到访问日志已经被ELK搜集了:
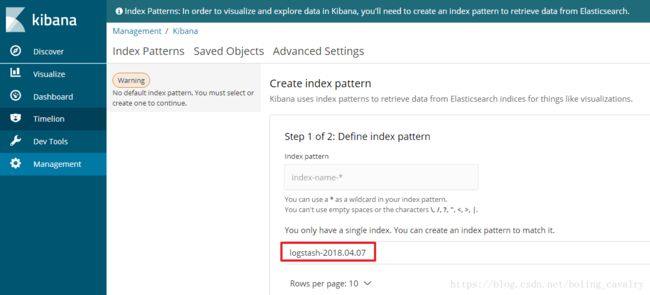
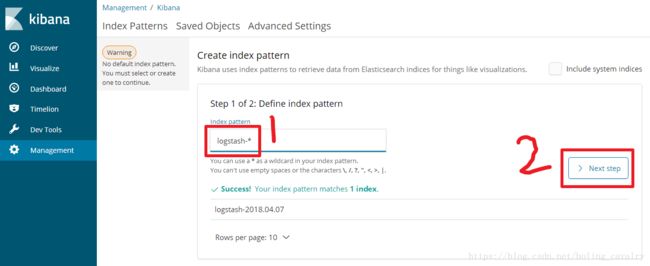
- 如下图,输入logstash-*,点击"Next step":
- 如下图,选择Time Filter,再点击“Create index pattern”:

- 页面提示创建Index Patterns成功:
- 点击左上角的"Discover"按钮,即可看到最新的日志信息,如下图:

至此,我们已经可以在ELK上查到Nginx的访问日志了,接下来将Tomcat的日志也接进来;
安装和启动Tomcat
- 确保nginx-server电脑上已经安装了JDK8;
- 在/usr/local/work/目录下执行以下命令,下载Tomcat:
wget http://mirrors.tuna.tsinghua.edu.cn/apache/tomcat/tomcat-7/v7.0.85/bin/apache-tomcat-7.0.85.zip
3. 解压缩: unzip apache-tomcat-7.0.85.zip 4. 给脚本赋予可执行权限: chmod a+x /usr/local/work/apache-tomcat-7.0.85/bin/*.sh 5. 启动: /usr/local/work/apache-tomcat-7.0.85/bin/startup.sh 6. 浏览器访问:http://192.168.119.133:8080,看到启动成功,如下图: 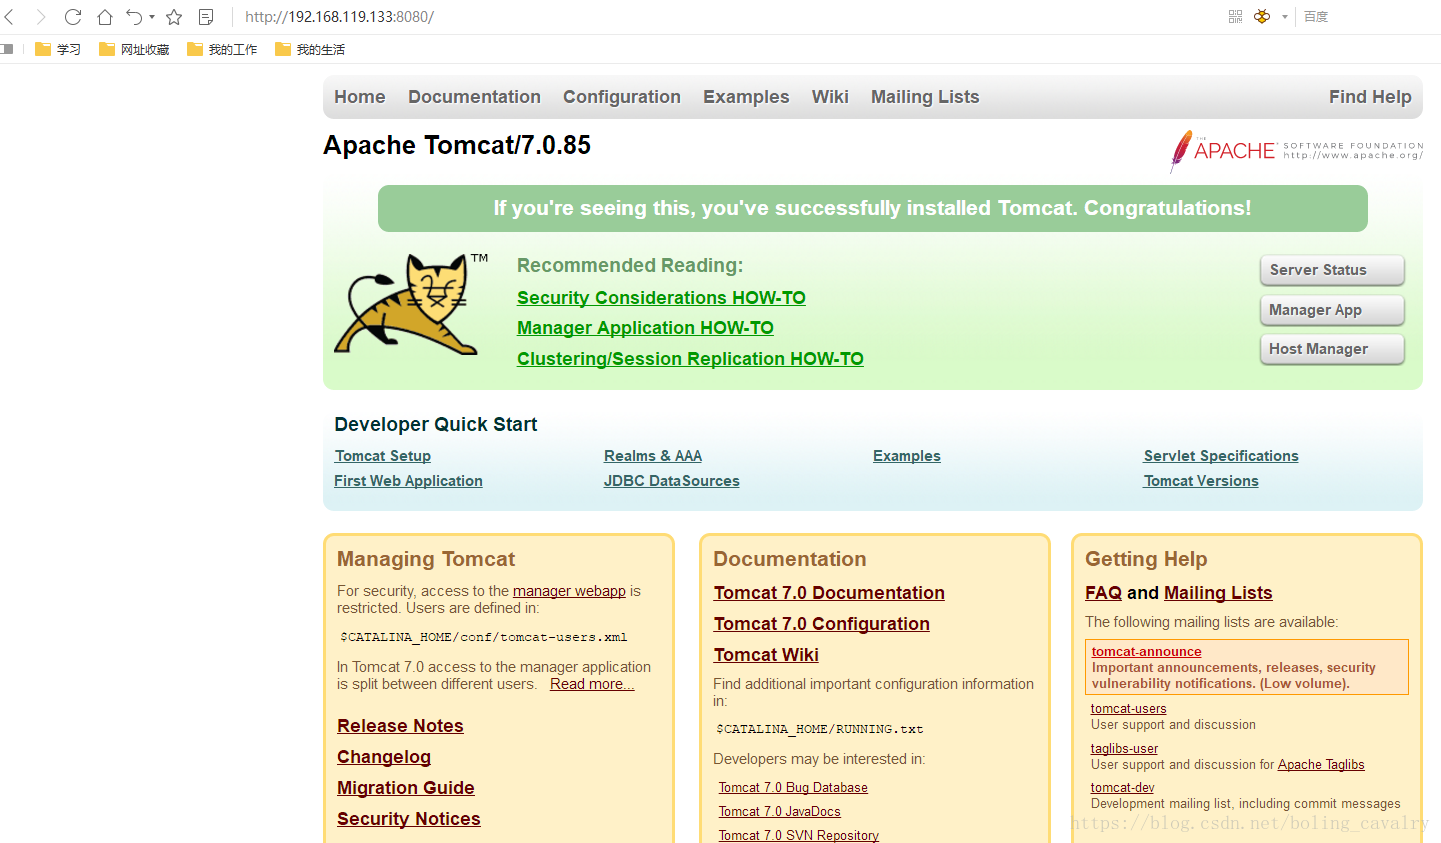
7. 访问Tomcat提供的example服务的子页面:http://192.168.119.133:8080/examples/servlets/servlet/RequestInfoExample,如下图: 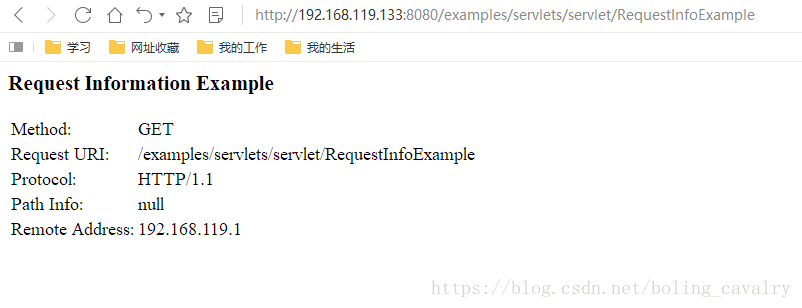
至此,Tomcat已经启动成功,接下来将Tomcat的访问日志接入ELK;
Tomcat访问日志接入ELK
- 打开FileBeat的配置文件/usr/local/work/filebeat-6.2.3-linux-x86_64/filebeat.yml,在"filebeat.prospectors:"下面新增一个配置节点,内容如下:
- type: log
  enabled: true
  paths:
    - /usr/local/work/apache-tomcat-7.0.85/logs/localhost_access_log.*.txt
配置好的filebeat.yml有两个type节点了,如下图:

2. 停掉filebeat服务,再用./filebeat -e -c filebeat.yml -d "publish"命令启动filebeat服务;
3. 此时在Kibana页面已经可以搜索到Tomcat的访问日志,以“RequestInfoExample”作为关键词搜索也能搜到对应的访问日志:

至此,ELK-6.2.3版本的服务和日志上报的搭建已经完成,后续如果还有业务服务器要上报日志,只需按照上述步骤安装和配置FileBeat即可;
欢迎关注我的公众号:程序员欣宸
