OpenCV之颜色空间转换、掩膜(mask)、颜色提取——python实现
一、颜色空间转换
OpenCV有150中颜色空间转换方法,可以使用以下方式查看所有颜色空间转换方法
- str.startswith()函数:用于判断一个字符串是否为某个字符串的开头。
- dir()函数:带参数时,返回参数的属性、方法列表。
import cv2
flags = [i for i in dir(cv2) if i.startswith('COLOR_')]
print(flags)
输出:往后拉有很多
- 本文只关注BGR---->HSV 和 HSV---->BGR 的转换
- 颜色空间转换使用:cv2.cvtColor(input_image, flag),
BGR---->HSV : flag取cv2.COLOR_BGR2HSV
HSV---->BGR : flag取cv2.COLOR_HSV2BGR
二、提取图像中的多种颜色
目的:提取红绿蓝三色
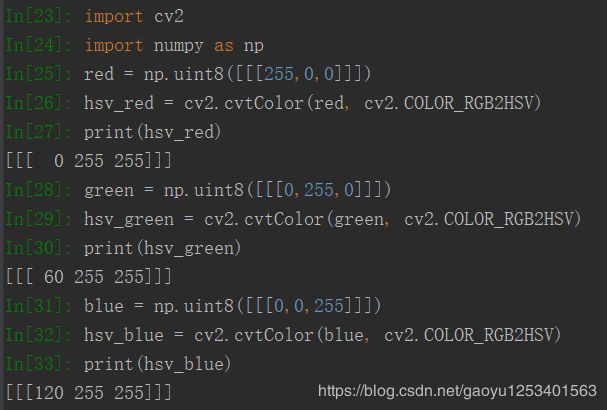
1、首先使用cv2.cvtColor()函数获取HSV空间中提取颜色对应的HSV范围值
对于red、green、blue三个通道,分别取 [H-10,100,100] 和 [H + 10,255,255] 作为下限和上限。
注意:由于我们要使用matplotlib库进行最后图像的显示,但是OpenCV读入的彩色图像是BGR模式,matplotlib库中使用函数进行显示格式是RGB模式,因此我们需要进行转换:
参考:https://blog.csdn.net/gaoyu1253401563/article/details/85053142 (第三部分)
2、具体代码实现
import cv2
import numpy as np
import matplotlib.pyplot as plt

#读入的图像是BGR空间图像
frame = cv2.imread("C:\\Users\\NWPU\\Desktop\\3.png")

# 部分1:将BGR空间的图片转换到HSV空间
hsv = cv2.cvtColor(frame, cv2.COLOR_BGR2HSV)

#部分2:
# 在HSV空间中定义蓝色
lower_blue = np.array([110, 100,100])
upper_blue = np.array([130, 255, 255])
# 在HSV空间中定义绿色
lower_green = np.array([50, 100, 100])
upper_green = np.array([70, 255, 255])
# 在HSV空间中定义红色
lower_red = np.array([0, 100, 100])
upper_red = np.array([10, 255, 255])

#部分3:
# 从HSV图像中截取出蓝色、绿色、红色,即获得相应的掩膜
# cv2.inRange()函数是设置阈值去除背景部分,得到想要的区域
blue_mask = cv2.inRange(hsv, lower_blue, upper_blue)
green_mask = cv2.inRange(hsv, lower_green, upper_green)
red_mask = cv2.inRange(hsv, lower_red, upper_red)

#部分4:
# 将原图像和mask(掩膜)进行按位与
blue_res = cv2.bitwise_and(frame, frame, mask = blue_mask)
green_res = cv2.bitwise_and(frame, frame, mask = green_mask)
red_res = cv2.bitwise_and(frame, frame, mask = red_mask)

#最后得到要分离出的颜色图像
res = blue_res + green_res + red_res


#部分5:将BGR空间下的图片转换成RGB空间下的图片
frame = frame[:,:,::-1]
blue_res = blue_res[:,:,::-1]
green_res = green_res[:,:,::-1]
red_res = red_res[:,:,::-1]
res = res[:,:,::-1]

#部分6:显示图像
plt.figure(figsize=(14,12))
plt.subplot(2,2,1),plt.title('original_image'), plt.imshow(frame)
plt.subplot(2,2,2), plt.imshow(blue_mask, cmap = 'gray')
plt.subplot(2,2,3), plt.imshow(green_mask, cmap= 'gray')
plt.subplot(2,2,4), plt.imshow(red_mask, cmap= 'gray')

plt.figure(figsize=(14,12))
plt.subplot(2,2,1), plt.imshow(blue_res)
plt.subplot(2,2,2), plt.imshow(green_res)
plt.subplot(2,2,3), plt.imshow(red_res)
plt.subplot(2,2,4), plt.imshow(res)
plt.show()
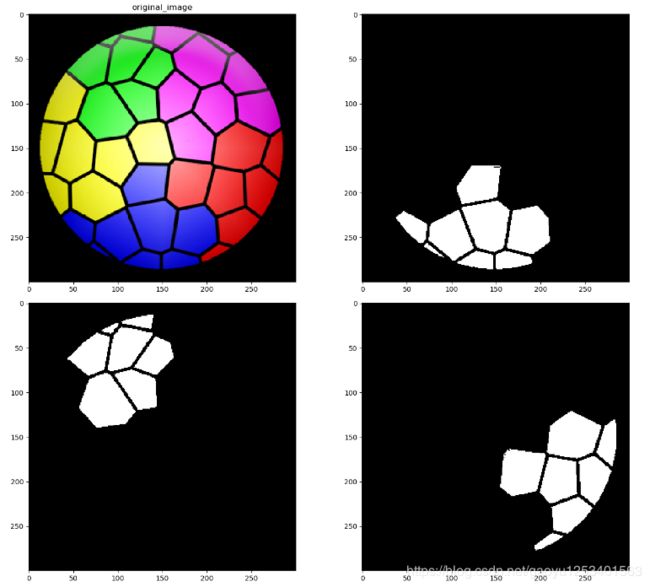
结果显示:
代码分析:
部分3:cv2.inRange()函数,其是实现二值化功能,设置相应的阈值,去除背景(不需要的部分),为黑色;得到想要的区域,为白色。
部分5:将图像从BGR空间转换到RGB空间,应该是可以用,cv2.COLOR_BGR2RGB,但是为了更好的展示我们使用此种方法,具体可参考:
https://blog.csdn.net/gaoyu1253401563/article/details/85053142
stackoverflow上的讲解
部分6:对于plt.imshow()函数
格式:matplotlib.pyplot.imshow(X, cmap = None)
X:要绘制的图像或者数组
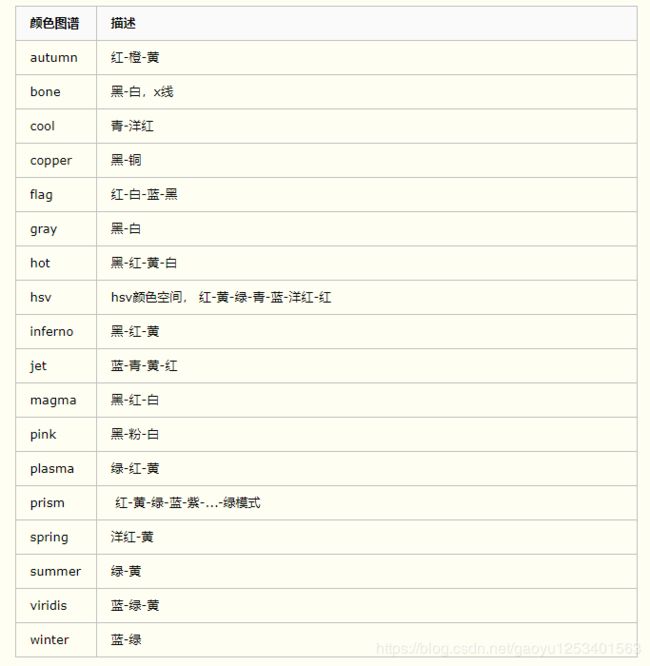
cmap:颜色图谱,默认绘制是RGB颜色空间
可选如下:
在绘制mask图像时,由于其是二值图像,因此我们需要使用非默认参数,即使用 cmap = 'gray'
plt.subplot(2,2,2), plt.imshow(blue_mask, cmap = 'gray')
plt.subplot(2,2,3), plt.imshow(green_mask, cmap= 'gray')
plt.subplot(2,2,4), plt.imshow(red_mask, cmap= 'gray')


