Prometheus介绍与MySQL监控
文章目录
- Prometheus介绍与MySQL监控
- 简介
- 组件
- 特点
- 工作流程
- 数据模型
- 四种 Metric 类型
- 数据存储
- 数据展示
- 监控mysql的例子
- 配置
- 安装mysqld_exporter
- 将数据展示在Grafana
- 配置数据源
- 其它监控
Prometheus介绍与MySQL监控
原文章地址 : Prometheus介绍与MySQL监控
简介
普罗米修斯是一个开源系统监控和警报工具包。
它能监控很多东西,比如机器,JMX,数据库,一些软件等。
git地址: https://github.com/prometheus
组件
- Prometheus Server : 用于收集和存储时间序列数据。
- Client Library : 客户端库,为需要监控的服务生成相应的 metrics 并暴露给 Prometheus server。当Prometheus server 来 pull 时,直接返回实时状态的 metrics。
- Push Gateway : 主要用于短期的 jobs。由于这类 jobs 存在时间较短,可能在 Prometheus 来 pull 之前就消失了。为此,这次 jobs 可以直接向 Prometheus server 端推送它们的 metrics。这种方式主要用于服务层面的metrics,对于机器层面的 metrices,需要使用 node exporter。
- Exporters : 用于暴露已有的第三方服务的 metrics 给 Prometheus。
- Alertmanager : 从 Prometheus server 端接收到 alerts 后,会进行去除重复数据,分组,并路由到对收的接受方式,发出报警。常见的接收方式有:电子邮件,pagerduty,OpsGenie, webhook 等。
- 一些其他的工具。
架构图:
特点
- 多维数据模型
- 时间序列数据通过metric名和键值对来区分
- 所有的metrics都是可以设置为多维标签
- 灵活的查询语句
- 高效
- 采用pull模式采集时间序列
- 可以采用push gateway的方式推送数据之Prometheus server端
- 可以通过服务发现或者静态配置去获取监控的targets
工作流程
其大概的工作流程是:
- Prometheus server 定期从配置好的 jobs 或者 exporters 中拉 metrics,或者接收来自 Pushgateway 发过来的 metrics,或者从其他的 Prometheus server 中拉 metrics。
- Prometheus server 在本地存储收集到的 metrics(保存在
data目录下),并运行已定义好的 alert.rules,记录新的时间序列或者向 Alertmanager 推送警报。 - Alertmanager 根据配置文件,对接收到的警报进行处理,发出告警。
- 在图形界面中,可视化采集数据。
数据模型
Prometheus 中存储的数据为时间序列,是由 metric 的名字和一系列的标签(键值对)唯一标识的,不同的标签则代表不同的时间序列。
- metric 名字:该名字应该具有语义,一般用于表示 metric 的功能,例如:
http_requests_total, 表示 http 请求的总数。 - 标签:使同一个时间序列有了不同维度的识别。例如
http_requests_total{method="Get"}表示所有 http 请求中的 Get 请求。当 method=“post” 时,则为新的一个 metric。 - 样本:实际的时间序列,每个序列包括一个 float64 的值和一个毫秒级的时间戳。
- 格式:
{ http_requests_total{method="POST",endpoint="/api/tracks"}。
四种 Metric 类型
Counter :一种累加的 metric,典型的应用如:请求的个数,结束的任务数, 出现的错误数等等。
Gauge :可以任意加减。
Histogram :
- 可以理解为柱状图,典型的应用如:请求持续时间,响应大小。
- 可以对观察结果采样,分组及统计。
Summary - 类似于 Histogram, 典型的应用如:请求持续时间,响应大小。
- 提供观测值的 count 和 sum 功能。
- 提供百分位的功能,即可以按百分比划分跟踪结果。
数据存储
- Prometheus将数据存储在本地或者与远程存储系统集成。
- 默认将数据两个小时分为一块
- 不足两个小时的数据存在内存中,并且通过存储zai
data/wal下的日志防止崩溃 - 数据保存时间可自定义
--storage.tsdb.retention.time
数据展示
在Prometheus中数据往往不够直观,可以使用Grafana来展示数据。
Grafana支持多种数据源,包括Prometheus。
Grafana的Dashboard的对应的json文件也都有提供,因此十分方便
监控mysql的例子
Premetheus下载地址
配置
配置服务端:prometheus/prometheus.yml文件
# my global config
global:
  scrape_interval:     15s # Set the scrape interval to every 15 seconds. Default is every 1 minute.
  evaluation_interval: 15s # Evaluate rules every 15 seconds. The default is every 1 minute.
  # scrape_timeout is set to the global default (10s).

# Alertmanager configuration
alerting:
  alertmanagers:
  - static_configs:
    - targets:
      # - alertmanager:9093

# Load rules once and periodically evaluate them according to the global 'evaluation_interval'.
rule_files:
  # - "first_rules.yml"
  # - "second_rules.yml"

# A scrape configuration containing exactly one endpoint to scrape:
# Here it's Prometheus itself.
scrape_configs:
  # The job name is added as a label `job=` to any timeseries scraped from this config.
 # 监控自己
  - job_name: 'prometheus'

    # metrics_path defaults to '/metrics'
    # scheme defaults to 'http'.
    static_configs:
    - targets: ['localhost:9090']
#抓取的目标的名字,以及地址
  - job_name: 'mysql'
    static_configs:
    - targets: ['localhost:9104']
启动prometheus.exe,此时在浏览器中输入localhost:9090,点击Status->Target
抓取自己的数据成功,由于mysql还没有暴露抓取的指标,因此还处于down。
安装mysqld_exporter
- 下载地址
- 在运行前可以先给mysql创建一个用户专门用来export指标数据
CREATE USER 'exporter'@'localhost' IDENTIFIED BY 'root' WITH MAX_USER_CONNECTIONS 3;
GRANT PROCESS, REPLICATION CLIENT, SELECT ON *.* TO 'exporter'@'localhost';
flush privileges;
- 在运行前需要配置暴露的数据源,直接添加环境变量
#swtest是要监控的数据库
set DATA_SOURCE_NAME=exporter:root@(localhost:3306)/swtest
set path=%path%;DATA_SOURCE_NAME='exporter:root@(localhost:3306)
- 启动
mysqld_exporter.exe
- 检验,在浏览器中输入
http://localhost:9104/metrics,看到有非常多的数据表示成功,如果仅仅只有几十条数据或者更少,说明暴露指标过程中有问题,一般是数据库登录问题
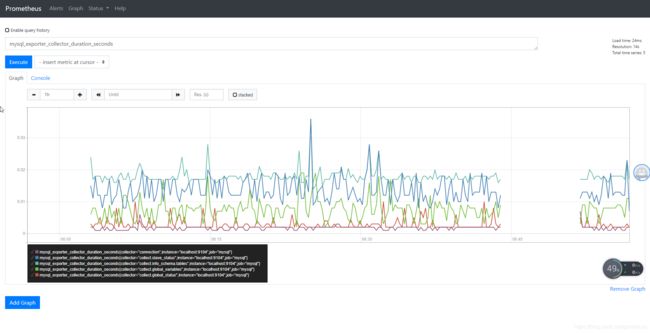
在prometheus界面输一个指标name,比如mysql_exporter_collector_duration_seconds,点击execute,Graph,可以看见数据
将数据展示在Grafana
- 下载地址,版本6.2.0
- 安装方法
以windows举例:
下载,解压(解压前,右键选择属性,点击解除锁定)
复制conf/sample.ini为conf/custom.ini,编辑内容,更该http_port,默认为3000,建议更改
# The http port  to use
http_port = 10000
在命令行上启动,在浏览器中输入localhost:10000,登录admin:admin
配置数据源
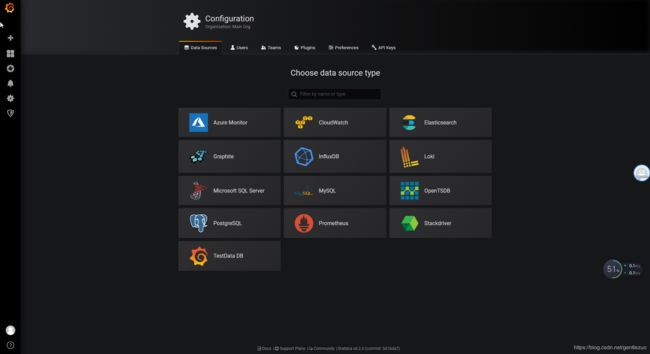
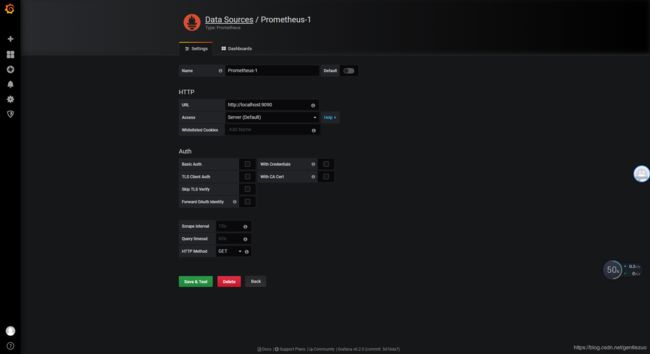
登录后在侧边栏点击Configuration,选择dataSource,Grafana支持多种数据源
填入对应数据,保存。
需要导入对应的dashboard,可以自定义,也可以使用已经写好的https://github.com/percona/grafana-dashboards,clone后在dashboards目录下有常用的dashboard的json文件。
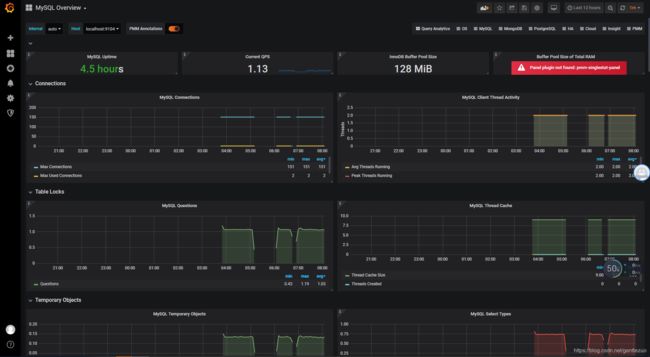
在dashboard选择manage,选择import,然后上传dashboards/MySQL_Overview.json,然后点击import
成功界面:
其它监控
一法通万法通
参考:
https://prometheus.io/docs/introduction/overview/
https://www.ibm.com/developerworks/cn/cloud/library/cl-lo-prometheus-getting-started-and-practice/index.html


