TensorFlow实战--房价预测模型(二)【数据处理】
单变量房价预测问题
- 问题描述:根据房屋面积x预测其销售价格y
多变量房价预测问题:数据分析
- 问题描述:根据房屋面积x1和卧室数量x2,预测其销售价格y
多变量房价预测问题:特征归一化
- 房屋面积和卧室数量这两个变量(特征)在数值上差了1000倍。在这种情况下,通常先进性特征缩放(Scaling),再开始训练,可以加速模型收敛。
举例方法1:x’ =(变量-平均值)/ 标准差
使用TensorFlow 训练模型的工作流
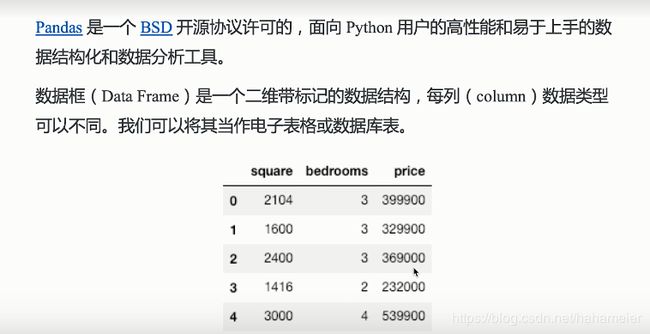
数据分析库:Pandas
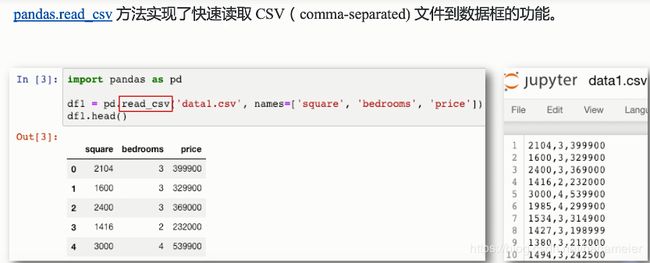
数据读入
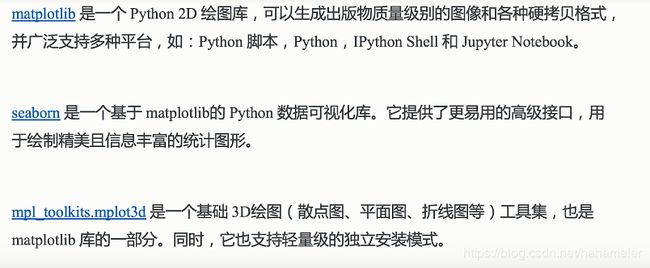
数据可视化
数据分析(2D)
import pandas as pd
import seaborn as sns
sns.set(context = "notebook", style = "whiteqrid", palette = "dark")

df0 = pd.read_csv('data0.csv', names = ['square' , 'price' ])
sns.lmplot('square' , 'price', df0, height = 6, fit_req = True)
数据分析(3D)
from mpl_toolkits import mplot3d

import pandas as pd
import matplotlib.pyplot as plt

df1 = pd.read_csv('data0.csv', names = ['square' , 'bedroom' , 'price' ])
df1.head()

fig = plt.figure()
ax = plt.axes(projection='3d')//设置为3D格式
ax.set_xlabel('square')
ax.set_ylabel('bedroom')
ax.set_zlabel('price')
ax.scatter3D(df1['square'] , df1['bedroom'] , df1['price'] , c = df1[ 'price' ] , cmap='Greens')//前三个参数为设置坐标,c表示关于哪一个参数颜色的深浅有变化,cmap表示设置颜色
数据归一化(3D)
def  normalize_feature(df):
	return df.apply(lambda column: (column - column.mean())) / column.std())

df = normalize_feature(df1)
ax = plt.axes(projection='3d')
ax.set_xlabel('square')
ax.set_ylabel('bedrooms')
ax.set_zlabel('price')
ax.scatter3D(df['square'], df['bedroooms'], df['price'],c=df['price'], cmap='Reds')
数据处理:NumPy
NumPy是一个BSD开源协议许可的,面向Python用户的基础科学计算库,在多维数组上实现了线性代数、傅立叶变换和其他丰富的函数运算。
import pandas as pd
import numpy as np

def normalize_feature(df):
	return df.apply(lambda column: (column - column.mean() / column.std()))

df = normalize_feature(pd.read_csv('datal.csv', names=['square', 'bedroom', 'price']))

ones = pd.DataFrame({'ones': np.ones(len(df))})#ones是n行1列的数据框,表示x0恒为1
df = pd.concat([ones,df], axis=1)#根据列合并数据

X_data = np.array(df[df.columns[0:3]])#取的0-2列,即前三列;左闭右开的区间
y_data = np.array(df[df.column[-1]]).reshape(len(df), 1)#-1就是最后一列

print(X_data.shape, type(X_data))
print(y_data.shape, type(y_data))


