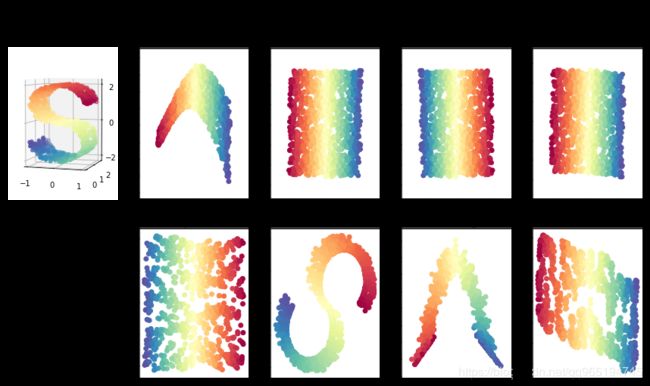
使用说明具体见官方的文档
https://scikit-learn.org/stable/modules/generated/sklearn.manifold.TSNE.html
这里挑选了一个简单的例子来重构成了一个方便调用的接口
%matplotlib inline
# Author: Jake Vanderplas --
print(__doc__)
from time import time
import matplotlib.pyplot as plt
from mpl_toolkits.mplot3d import Axes3D
from matplotlib.ticker import NullFormatter
from sklearn import manifold, datasets
# Next line to silence pyflakes. This import is needed.
Axes3D
def Comparison_of_Manifold_Learning_methods(X, color, n_neighbors=10):
"""
改写了官网的案例,接受高维数据X和其对应的color来进行流形降维
https://scikit-learn.org/stable/auto_examples/manifold/plot_compare_methods.html#sphx-glr-auto-examples-manifold-plot-compare-methods-py
n_components : int, optional (must be: 2)
Dimension of the embedded space.
"""
n_points = len(X)
n_neighbors = 10
n_components = 2
fig = plt.figure(figsize=(15, 8))
plt.suptitle("Manifold Learning with %i points, %i neighbors"
% (n_points, n_neighbors), fontsize=14)
if X[0].size == 3:
ax = fig.add_subplot(251, projection='3d')
ax.scatter(X[:, 0], X[:, 1], X[:, 2], c=color, cmap=plt.cm.Spectral)
ax.view_init(4, -72)
methods = ['standard', 'ltsa', 'hessian', 'modified']
labels = ['LLE', 'LTSA', 'Hessian LLE', 'Modified LLE']
for i, method in enumerate(methods):
t0 = time()
Y = manifold.LocallyLinearEmbedding(n_neighbors, n_components,
eigen_solver='auto',
method=method).fit_transform(X)
t1 = time()
print("%s: %.2g sec" % (methods[i], t1 - t0))
ax = fig.add_subplot(252 + i)
plt.scatter(Y[:, 0], Y[:, 1], c=color, cmap=plt.cm.Spectral)
plt.title("%s (%.2g sec)" % (labels[i], t1 - t0))
ax.xaxis.set_major_formatter(NullFormatter())
ax.yaxis.set_major_formatter(NullFormatter())
plt.axis('tight')
t0 = time()
Y = manifold.Isomap(n_neighbors, n_components).fit_transform(X)
t1 = time()
print("Isomap: %.2g sec" % (t1 - t0))
ax = fig.add_subplot(257)
plt.scatter(Y[:, 0], Y[:, 1], c=color, cmap=plt.cm.Spectral)
plt.title("Isomap (%.2g sec)" % (t1 - t0))
ax.xaxis.set_major_formatter(NullFormatter())
ax.yaxis.set_major_formatter(NullFormatter())
plt.axis('tight')
t0 = time()
mds = manifold.MDS(n_components, max_iter=100, n_init=1)
Y = mds.fit_transform(X)
t1 = time()
print("MDS: %.2g sec" % (t1 - t0))
ax = fig.add_subplot(258)
plt.scatter(Y[:, 0], Y[:, 1], c=color, cmap=plt.cm.Spectral)
plt.title("MDS (%.2g sec)" % (t1 - t0))
ax.xaxis.set_major_formatter(NullFormatter())
ax.yaxis.set_major_formatter(NullFormatter())
plt.axis('tight')
t0 = time()
se = manifold.SpectralEmbedding(n_components=n_components,
n_neighbors=n_neighbors)
Y = se.fit_transform(X)
t1 = time()
print("SpectralEmbedding: %.2g sec" % (t1 - t0))
ax = fig.add_subplot(259)
plt.scatter(Y[:, 0], Y[:, 1], c=color, cmap=plt.cm.Spectral)
plt.title("SpectralEmbedding (%.2g sec)" % (t1 - t0))
ax.xaxis.set_major_formatter(NullFormatter())
ax.yaxis.set_major_formatter(NullFormatter())
plt.axis('tight')
t0 = time()
tsne = manifold.TSNE(n_components=n_components, init='pca', random_state=0)
Y = tsne.fit_transform(X)
t1 = time()
print("t-SNE: %.2g sec" % (t1 - t0))
ax = fig.add_subplot(2, 5, 10)
plt.scatter(Y[:, 0], Y[:, 1], c=color, cmap=plt.cm.Spectral)
plt.title("t-SNE (%.2g sec)" % (t1 - t0))
ax.xaxis.set_major_formatter(NullFormatter())
ax.yaxis.set_major_formatter(NullFormatter())
plt.axis('tight')
plt.show()
Automatically created module for IPython interactive environment
n_points = 1000
X, color = datasets.samples_generator.make_s_curve(n_points, random_state=0)
Comparison_of_Manifold_Learning_methods(X, color)
standard: 0.16 sec
ltsa: 0.27 sec
hessian: 0.31 sec
modified: 0.23 sec
Isomap: 0.5 sec
MDS: 4.1 sec
SpectralEmbedding: 0.08 sec
t-SNE: 22 sec