R语言ggplot2 对Facebook用户数据可视化分析
- 大数据部落
- 数据分析
- 算法
- 数据挖掘代写
- Computer
- science代写
- 数据科学Computer
- Science报告代写
- 无法打开原文
- 请右键新标签页打开
- R语言代写
- python代写
- 数据库代写
- 数据分析报告代写
- CS作业代写
- C代写
- C++代写
原文链接:http://tecdat.cn/?p=5895
读取Facebook的用户数据
getwd()## [1]“C:/ Users / HH / Desktop / R Data analyst”list.files()## [1]“07-tidy-data.pdf”“demystifying.R”## [3 ]“demystifyingR2_v3.html”“demystifyingR2_v3.Rmd”## [5]“EDA_Course_Materials.zip”“lesson3_student.html”## [7]“lesson3_student.rmd”“pseudo_facebook.tsv”## [9]“reddit.csv “”stateData.csv“## [11]”tidy-data.pdf“pf <-read.delim('pseudo_facebook.tsv')name(pf)## [1]”userid“”age“## [3 ]“dob_day”“dob_year”## [5]“dob_month”“gender”## [7]“tenure”“friend_count”## [9]“friendships_initiated”“likes”## [11]“likes_received”“mobile_likes “## [13]”mobile_likes_received“”www_likes“## [15]”www_likes_received“
用户生日直方图
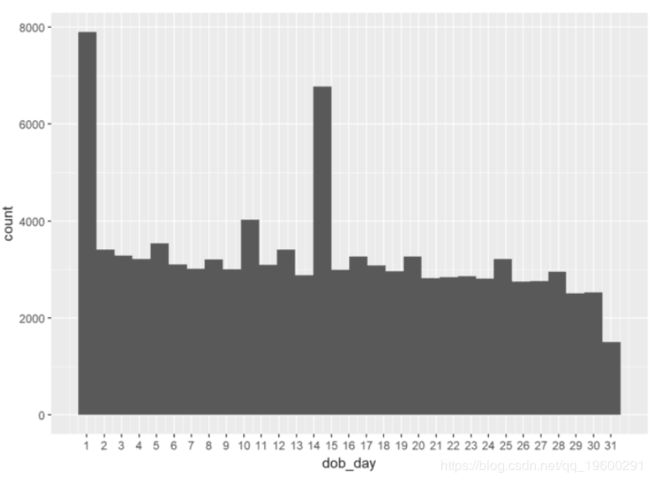
library(ggplot2)qplot(x = dob_day,data = pf)+ scale_x_continuous(breaks = 1:31)##`stat_bin()`using`bins = 30`。用`binwidth`选择更好的价值。
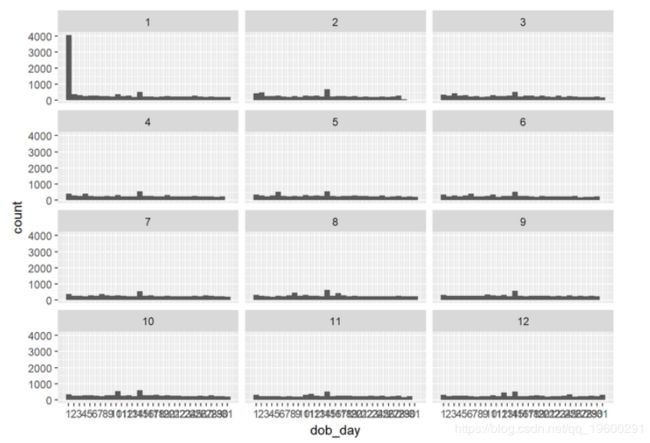
qplot(x = dob_day,data = pf)+ scale_x_continuous(breaks = 1:31)+ facet_wrap(~dob_month,ncol = 3)##`stat_bin()`使用`bins = 30`。用`binwidth`选择更好的价值。
朋友数
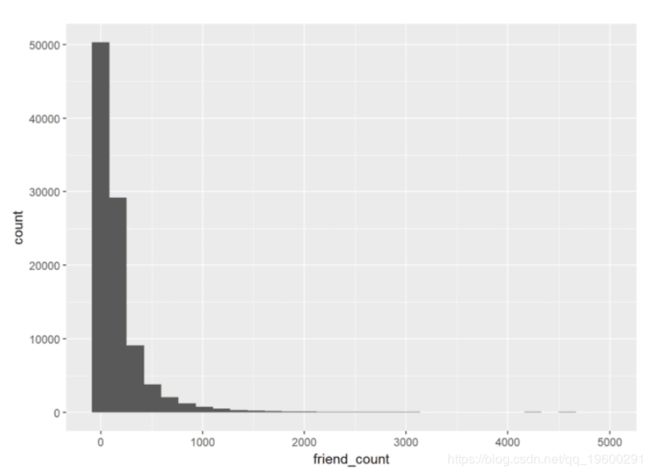
qplot(friend_count,data = pf)##`stat_bin()`使用`bins = 30`。用`binwidth`选择更好的价值。
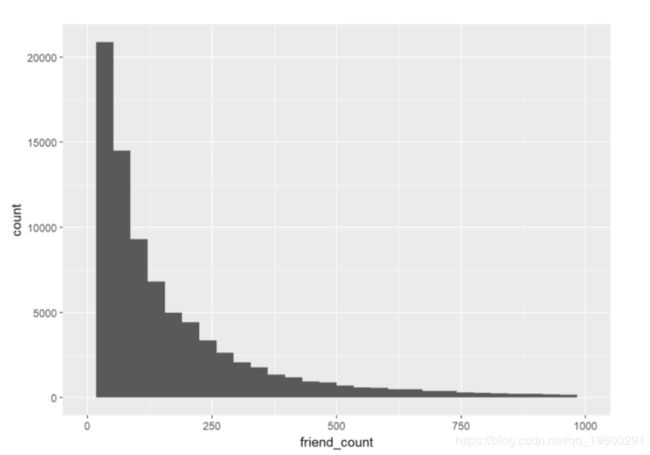
qplot(friend_count,data = pf)+ scale_x_continuous(limits = c(0,1000))##`stat_bin()`使用`bins = 30`。用`binwidth`选择更好的值。##警告:删除了包含非有限值(stat_bin)的2951行。
面对朋友数量
#你会添加什么代码来按性别创建直方图?#将它添加到下面的代码中.qplot(x = friend_count,data = pf,binwidth = 10)+ scale_x_continuous(limits = c(0,1000) ),break = seq(0,1000,50))+ facet_wrap(〜sex性)##警告:删除了包含非有限值(stat_bin)的2951行。
qplot(friend_count,data = subset(pf,!is.na(gender)),binwidth = 25)+ scale_x_continuous(limits = c(0,1000),breaks = seq(0,1000,50))+ facet_wrap(〜性别)##警告:删除了包含非有限值(stat_bin)的2949行。
table(pf $ gender)## ## female male ## 40254 58574by(pf $ friend_count,pf $ gender,summary)## pf $ gender:female ## Min。第一曲。中位数第3曲。最大。## 0 37 96 242 244 4923 ## --------------------------------------- - ---------------- ## pf $性别:男## Min。第一曲。中位数第3曲。最大。## 0 27 74 165 182 4917
谁有更多的朋友:男人还是女人?
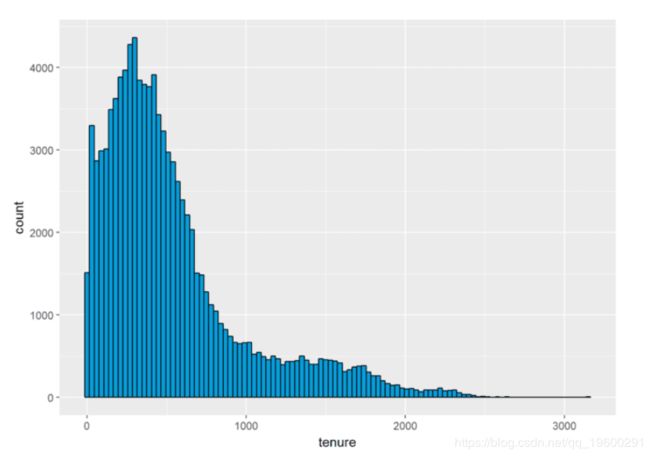
qplot(x = tenure,data = pf,binwidth = 30,color = I('black'),fill = I('#099DD9'))##警告:删除了包含非有限值(stat_bin)的2行。
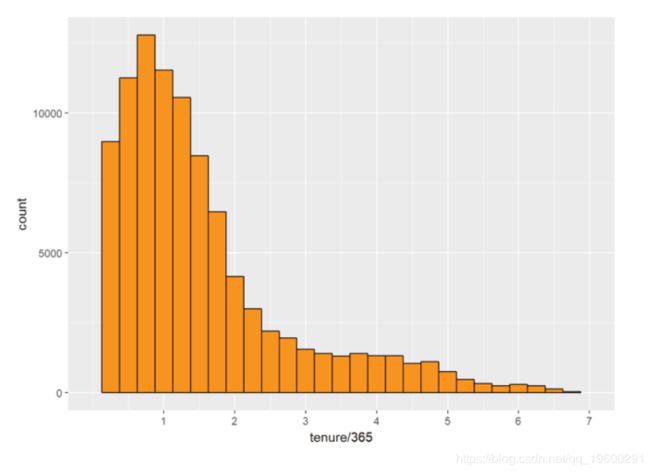
qplot(x = tenure / 365,data = pf,binwidth = .25,color = I('black'),fill = I('#F79420'))+ scale_x_continuous(breaks = seq(1,7,1), limits = c(0,7))##警告:删除了包含非有限值(stat_bin)的26行。
笔记:
qplot(x = tenure / 365,data = pf,xlab ='使用FB的年数',ylab ='样本中的用户数',binwidth = .25,color = I('black'),fill = I(' #F79420'))+ scale_x_continuous(breaks = seq(1,7,1),limits = c(0,7))##警告:删除了包含非有限值(stat_bin)的26行。
用户年龄
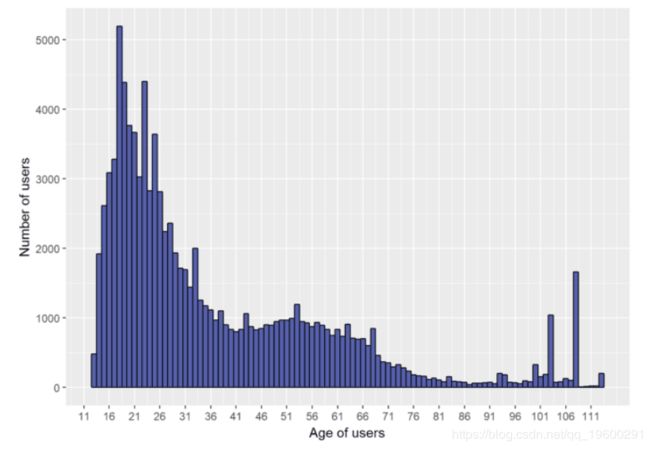
qplot(x =年龄,数据= pf,xlab ='用户年龄',ylab ='用户数',binwidth = 1,color = I('black'),fill = I('#5760AB'))+ scale_x_continuous(断裂= SEQ(1,113,5))
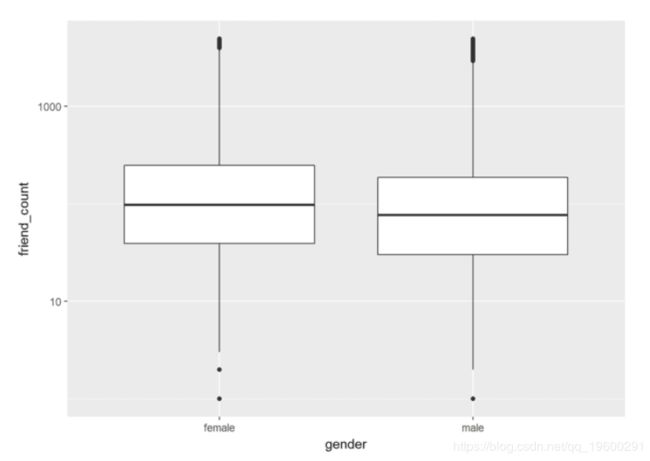
方块图
调整代码以关注朋友数在0到1000之间的用户。
▍需要帮助?联系我们
