前言
- Chart.js官网
- Chart.js中文文档
安装Chart.js
- 执行
cnpm install typings -g,全局安装Typings
-
执行
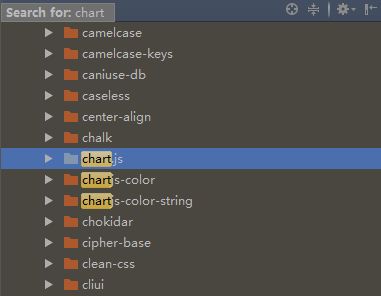
typings search chart.js,使用Typings搜索Chart.js
-
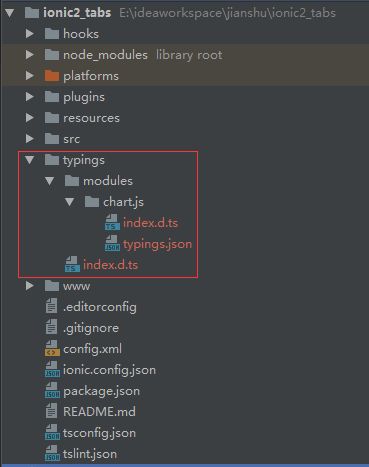
进入app目录执行
typings install chart.js --source npm
-
最后执行
cnpm install chart.js安装chart.js依赖
使用Chart.js
我的contact.html完整代码如下
Contact
我的contact.ts完整代码如下
import {Component, ViewChild, ElementRef} from '@angular/core';

import {NavController} from 'ionic-angular';
import Chart from 'chart.js'; // 导入chart.js

@Component({
  selector: 'page-contact',
  templateUrl: 'contact.html'
})
export class ContactPage {
  @ViewChild('chartBar') chartBar: ElementRef;
  @ViewChild('chartLine') chartLine: ElementRef;
  @ViewChild('chartPie') chartPie: ElementRef;

  constructor(private navCtrl: NavController) {

  }

  ionViewDidEnter() {
    Chart.Bar(this.chartBar.nativeElement.getContext("2d"), {
      data: {
        labels: ["Red", "Blue", "Yellow", "Green", "Purple", "Orange"],
        datasets: [{
          label: '呵呵',
          data: [12, 19, 3, 5, 2, 3],
          backgroundColor: [
            'rgba(255, 99, 132, 0.2)',
            'rgba(54, 162, 235, 0.2)',
            'rgba(255, 206, 86, 0.2)',
            'rgba(75, 192, 192, 0.2)',
            'rgba(153, 102, 255, 0.2)',
            'rgba(255, 159, 64, 0.2)'
          ],
          borderColor: [
            'rgba(255,99,132,1)',
            'rgba(54, 162, 235, 1)',
            'rgba(255, 206, 86, 1)',
            'rgba(75, 192, 192, 1)',
            'rgba(153, 102, 255, 1)',
            'rgba(255, 159, 64, 1)'
          ],
          borderWidth: 1
        }]
      },
      options: {
        scales: {
          yAxes: [{
            ticks: {
              beginAtZero: true
            }
          }]
        }
      }
    });

    Chart.Line(this.chartLine.nativeElement.getContext("2d"), {
      data: {
        labels: ["January", "February", "March", "April", "May", "June", "July"],
        datasets: [
          {
            label: "哈哈",
            fill: false,
            lineTension: 0.1,
            backgroundColor: "rgba(75,192,192,0.4)",
            borderColor: "rgba(75,192,192,1)",
            borderCapStyle: 'butt',
            borderDash: [],
            borderDashOffset: 0.0,
            borderJoinStyle: 'miter',
            pointBorderColor: "rgba(75,192,192,1)",
            pointBackgroundColor: "#fff",
            pointBorderWidth: 1,
            pointHoverRadius: 5,
            pointHoverBackgroundColor: "rgba(75,192,192,1)",
            pointHoverBorderColor: "rgba(220,220,220,1)",
            pointHoverBorderWidth: 2,
            pointRadius: 1,
            pointHitRadius: 10,
            data: [65, 59, 80, 81, 56, 55, 40],
            spanGaps: false,
          }
        ]
      }
    });

    Chart.Doughnut(this.chartPie.nativeElement.getContext("2d"), {
      data: {
        labels: [
          "Red",
          "Blue",
          "Yellow"
        ],
        datasets: [
          {
            data: [300, 50, 100],
            backgroundColor: [
              "#FF6384",
              "#36A2EB",
              "#FFCE56"
            ],
            hoverBackgroundColor: [
              "#FF6384",
              "#36A2EB",
              "#FFCE56"
            ]
          }]
      }
    });

  }
}
效果展示
效果展示.gif
其他
- ionic使用ECharts
- 完整app代码已上传github


