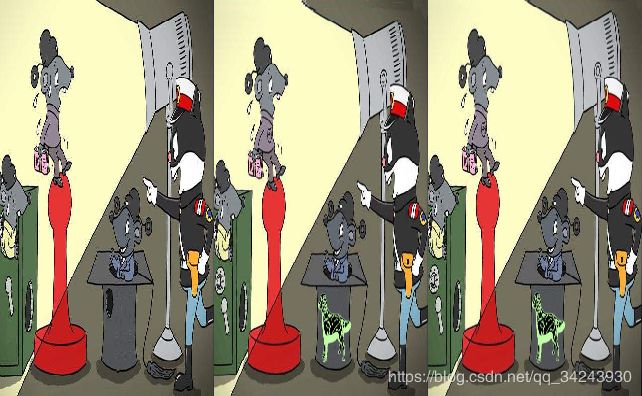
图像处理-图片找不同Find the differences of the two images #Matlab下调用Python接口#SIFT算法应用
说明
要求(含待处理图片等)、源代码见CSDN下载:https://download.csdn.net/download/qq_34243930/10882054
PPT展示见CSDN下载:https://download.csdn.net/download/qq_34243930/10882056
英文报告见CSDN下载:
https://download.csdn.net/download/qq_34243930/10889264
大作业要求
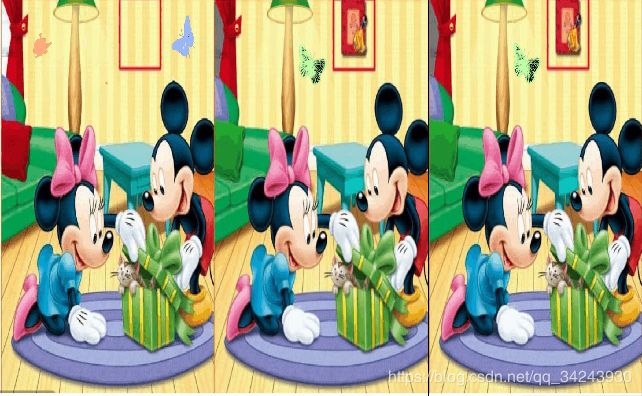
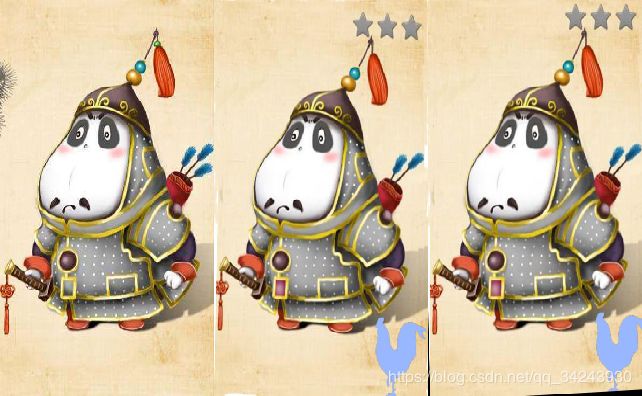
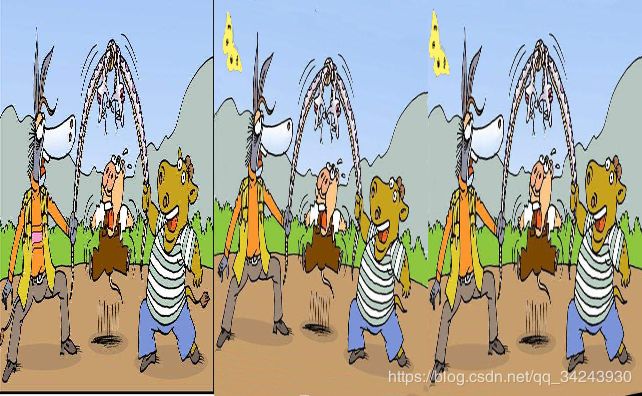
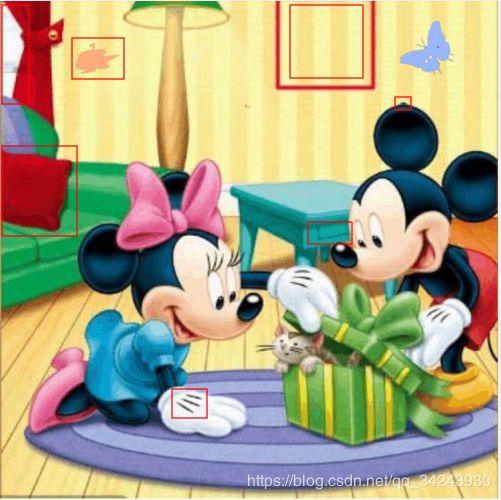
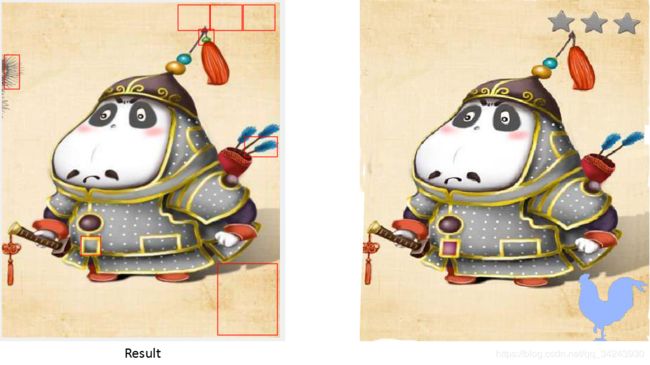
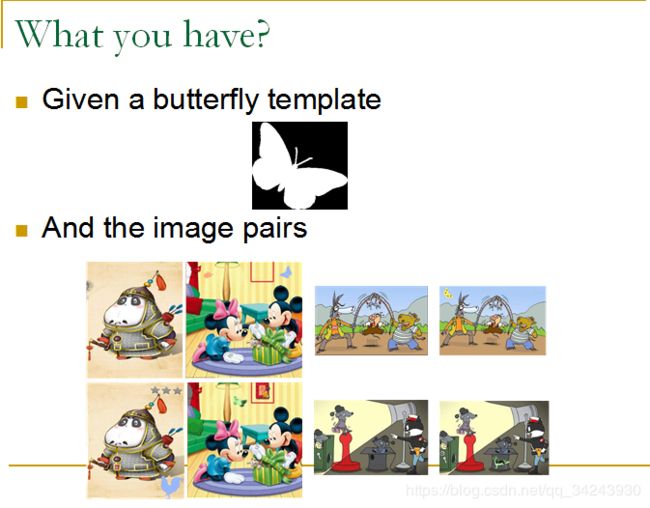
Task: Find the differences of the two images, ignoring butterfly
The code should be suitable for all image pairs.
找出经旋转或裁剪之后,像素点并不对应的两幅图片的不同之处。其中不同之处忽略蝴蝶~
算法需对给出的四对图片具有鲁棒性~

Introduction
Step1. mark butterflies(Matlab)
利用Matlab进行标注蝴蝶
Step2. image alignment (SIFT) (Python)
利用Python进行图像对齐
Step3. find differences (Matlab)
找出不同
环境配置
MATLAB
Python3
opencv-contrib-python安装
https://blog.csdn.net/a19990412/article/details/80933680
AttributeError: ‘module’ object has no attribute ‘xfeatures2d’?:
https://stackoverflow.com/questions/48328365/attributeerror-module-object-has-no-attribute-xfeatures2d
cv2.error: OpenCV(3.4.3) D:\Build\OpenCV\opencv_contrib-3.4.3\modules\xfeatures2d\src\sift.cpp:1207: error: (-213:The function/feature is not implemented) This algorithm is patented and is excluded in this configuration; Set OPENCV_ENABLE_NONFREE CMake option and rebuild the library in function ‘cv::xfeatures2d::SIFT::create’
把3.4.3卸载,pip uninstall xxx,然后pip install opencv-contrib-python==3.4.1.15,亲测成功.
Experiments
Step1. mark butterflies(Matlab)
% Example: mark_butterfly('1-1.jpg','butterfly.jpg');
function [r_x,r_y,r_w,r_h]=mark_butterfly(image1, butterfly)
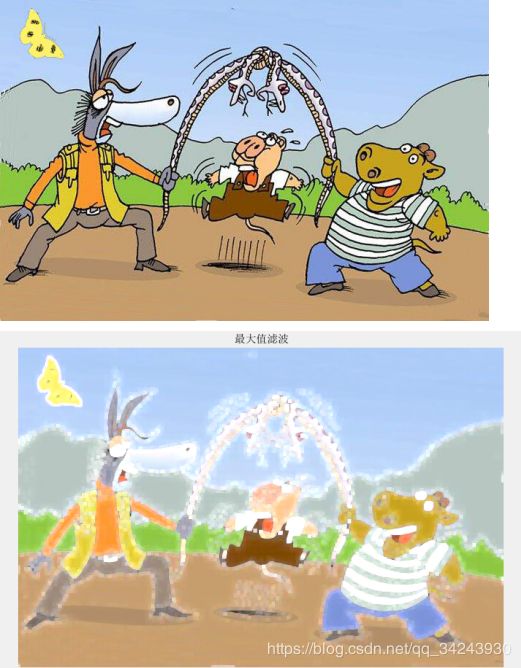
①maximum filter 最大值滤波
Due to the influence of the black butterfly stripe, binarization is very poor, so the first, I use filter.
The maximum filter is selected here to remove the butterfly stripe.
考虑到蝴蝶花纹的影响,采用最大值滤波去除蝴蝶花纹。
I=imread(image1);
[a,b,c]=size(I);

I1=I(:,:,1);
I2=I(:,:,2);
I3=I(:,:,3);
Y1=ordfilt2(I1,25,ones(5,5));
Y2=ordfilt2(I2,25,ones(5,5));
Y3=ordfilt2(I3,25,ones(5,5));
Z(:,:,1)=Y1;
Z(:,:,2)=Y2;
Z(:,:,3)=Y3;
%figure(2),imshow(Z);title('最大值滤波');
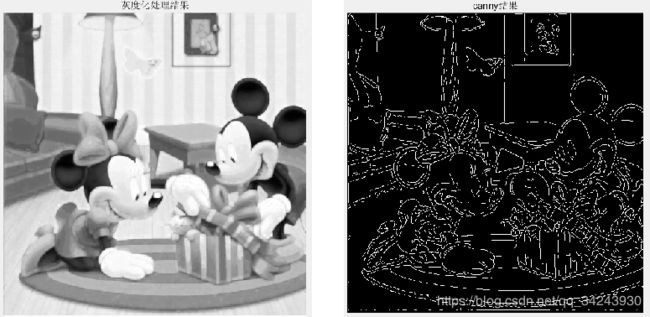
②extract the edge-canny 使用canny算子进行边缘提取
By extracting the edges, you can get the shape of a butterfly.
为了获得蝴蝶形状特征,采用边缘提取方法。
I2=rgb2gray(Z);
%figure(3),imshow(I2),title('灰度化处理结果');

%Canny边缘检测
I3=edge(I2,'canny');
%figure(4),imshow(I3),title('canny结果');
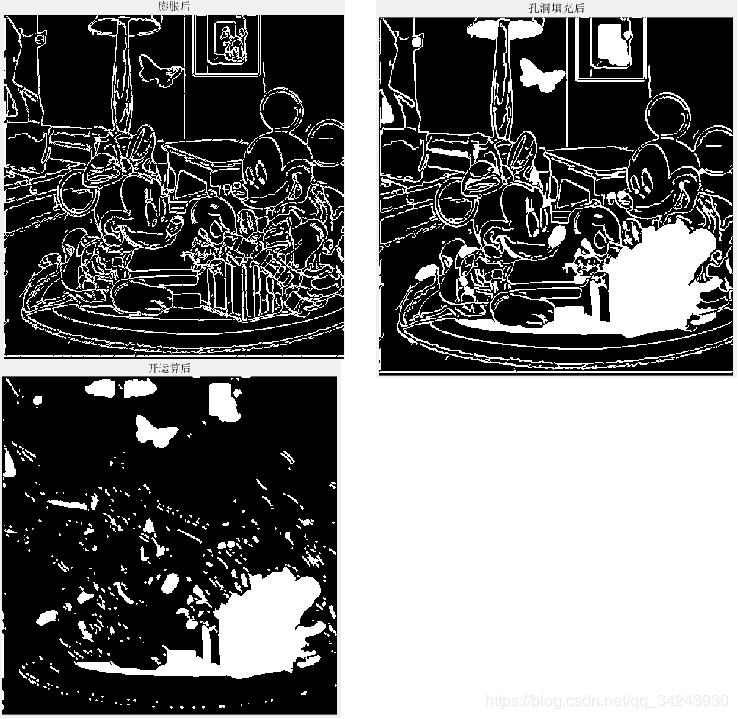
③region morphology 区域形态学
A3=imdilate(I3,strel('line',3,45)); % 膨胀
%figure(5),imshow(A3),title('膨胀后')

I4=imfill(A3,'holes');%孔洞填充
%figure(6),imshow(I4),title('孔洞填充后')

fo=imopen(I4,strel('disk',2));
%figure(7),imshow(fo),title('开运算后')
④Normalization of image size 图像大小的归一化
After the normalization of image size, it is convenient to extract butterflies by utilizing the features of butterfly pixel size.
在对图像大小进行归一化后,利用蝴蝶像素大小的特征,可以方便地提取蝴蝶。
%图像大小调整(图像大小的归一化)
I5 = imresize(fo,[sqrt(250000*a/b) sqrt(250000*b/a)],'bilinear');
%figure(8),imshow(I5);
%原图缩小
II = imresize(I,[sqrt(250000*a/b) sqrt(250000*b/a)],'bilinear');
%figure(8),imshow(II);
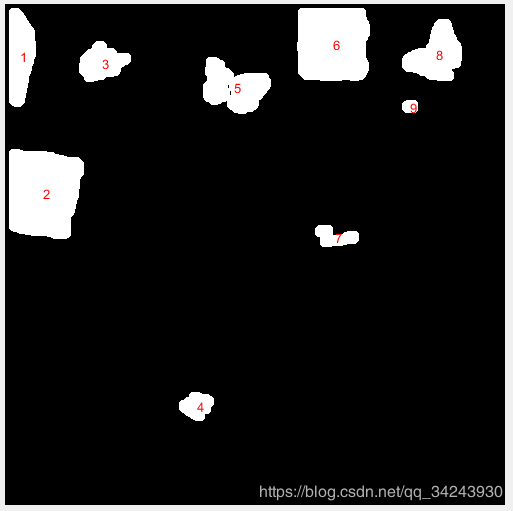
After ④ Normalization of image size and Before ⑤ labeling
I6 = bwareaopen(I5,1000);%删除二值图像中像素小于1000的对象
%figure(9),imshow(I6);

BW = bwareaopen(I5,3000);%删除二值图像中像素小于 的对象
%figure(10),imshow(BW);
I7=imsubtract(I6,BW);
%figure(11),imshow(I7);
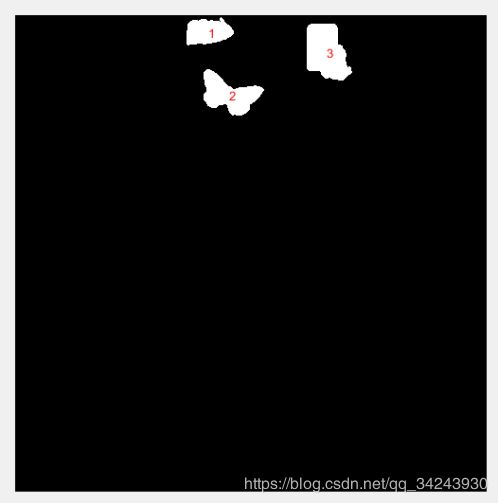
You can get pixels in the area of 1,000 to 3000
经过处理,可以得到像素值在1000-3000的像素。
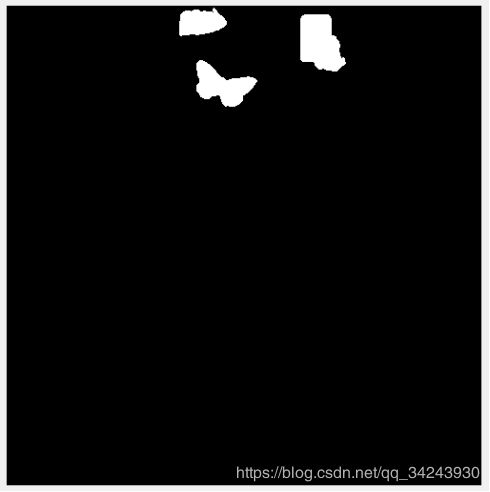
⑤labeling 标记
Before the extraction of connected components, you need label the connected components
[L,num]=bwlabel(I7,8); % 连通域标记
stats=regionprops(L,'boundingbox','Area');
rects=cat(1,stats.BoundingBox);%包含相应区域的最小矩形
⑥extraction of connected components-region features
Template processing–Gets the template pixel ratio
模板处理——获取模板像素比

%模板处理
M=imread(butterfly);
[line,row]=size(M);
counter=sum(sum(M>0));
p_0=(counter(:,:,1)+counter(:,:,2)+counter(:,:,3))/(line*row);%获得模板像素点比例
extraction of connected components-region features
利用区域特征进行连通域提取
The length and width of the template and the pixel feature are used to set the threshold for segmentation.
利用模板的长度和宽度以及像素特征用来设置分割提取的阈值。
flag=0;
for i=1:num
    [r c]=find(L==i);
     %figure(11),text(mean(c),mean(r),num2str(i),'Color', 'r');
     w=rects(i,3);
     h=rects(i,4);
     p=stats(i).Area/(h*w);
    if (rects(i,4)/rects(i,3)>0.75)&&(rects(i,4)/rects(i,3)<1.2)&&(p>(0.9*p_0))&&(p<(1.2*p_0))
             %figure(8),rectangle('position',rects(i,:),'EdgeColor','r','LineWidth',1)

            r_x= rects(i,1);%*(sqrt(a*b)/500);
            r_y= rects(i,2);%*(sqrt(a*b)/500);
            r_w= rects(i,3);%*(sqrt(a*b)/500);
            r_h= rects(i,4);%*(sqrt(a*b)/500);
            flag=1;
    end
end
if flag==0
        r_x=0;
        r_y=0;
        r_w=0;
        r_h=0;
end
Step2. image alignment (SIFT) (Python)
①SIFT feature points and feature description extraction 利用SIFT算法获得图像中的特征点和对应的特征描述
SIFT algorithm is used to obtain the feature points in the image and the corresponding feature description.
SIFT算法广泛使用在计算机视觉领域,在OpenCV中也对其进行了实现。
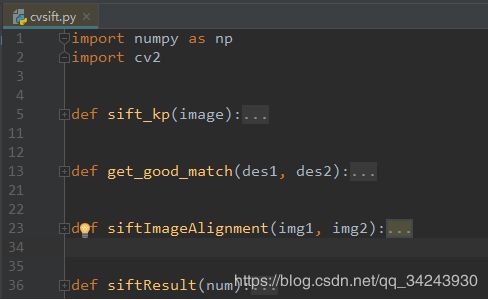
import numpy as np
import cv2


def sift_kp(image):
    gray_image = cv2.cvtColor(image, cv2.COLOR_BGR2GRAY)    # 颜色空间转换
    sift = cv2.xfeatures2d_SIFT.create()
    kps, des = sift.detectAndCompute(image, None)
    kp_image = cv2.drawKeypoints(gray_image, kps, None)     # 绘制关键点的函数
    return kp_image,kps,des
②SIFT feature point matching SIFT特征点匹配
SIFT algorithm obtains the feature points in the image and the corresponding feature description. How to match the feature points in two images?
In general, K nearest neighbor (KNN) algorithm can be used. The k-nearest neighbor algorithm takes the closest K data points in space and classifies them into a class. When matching feature points, KNN algorithm is generally used to find the two nearest neighbor data points. If the ratio of the closest and the second closest is greater than a given value, then we keep the closest value and consider that it matches the point as’ good match '.
SIFT算法得到了图像中的特征点以及相应的特征描述,如何把两张图像中的特征点匹配起来呢?一般的可以使用K近邻(KNN)算法。K近邻算法求取在空间中距离最近的K个数据点,并将这些数据点归为一类。在进行特征点匹配时,一般使用KNN算法找到最近邻的两个数据点,如果最接近和次接近的比值大于一个既定的值,那么我们保留这个最接近的值,认为它和其匹配的点为good match(有Lowe在SIFT论文中提出)。
def get_good_match(des1, des2):
    bf = cv2.BFMatcher()
    matches = bf.knnMatch(des1, des2, k=2)
    good = []
    for m, n in matches:
        if m.distance < 0.75 * n.distance:
            good.append(m)
    return good
③Homography Matrix 单应性矩阵
Through the above steps, we found a number of matching points in two graphs. How to align one graph with the other through rotation, transformation and other methods?
And that’s where the homology matrix comes in. Homography is the word for the same thing, Homo, which means the same thing, Homography, which means image, is the same thing that produces images. The points on the images from different perspectives have the following relations:

As you can see, the homography matrix has eight parameters. If you want to solve these eight parameters, you need eight equations. Since each corresponding pixel point can generate two equations (x one, y one), you only need four pixels to solve this homography matrix.
SIFT algorithm has been used to find a number of matching points (dozens or even hundreds), so which four points should be selected to calculate Homography matrix? RANSAC algorithm cleverly solves this problem.
通过上面的步骤,我们找到了若干两张图中的匹配点,如何将其中一张图通过旋转、变换等方式将其与另一张图对齐呢?这就用到了单应性矩阵了。Homography这个词由Homo和graphy,Homo意为同一,graphy意为图像,也就是同一个东西产生的图像。不同视角的图像上的点具有如下关系:

其中[x1 y1 1]和[x2 y2 1]分别表示对应像素的齐次坐标。
单应性矩阵就是下面这个矩阵:

可以看到,单应性矩阵有八个参数,如果要解这八个参数的话,需要八个方程,由于每一个对应的像素点可以产生2个方程(x一个,y一个),那么总共只需要四个像素点就能解出这个单应性矩阵。
在Opencv-Python中可以使用如下方式:
import cv2
H, status = cv2.findHomography(ptsA,ptsB,cv2.RANSAC,ransacReprojThreshold)
#其中H为求得的单应性矩阵矩阵
#status则返回一个列表来表征匹配成功的特征点。
#ptsA,ptsB为关键点
#cv2.RANSAC, ransacReprojThreshold这两个参数与RANSAC有关
这里就出现了一个问题,我们用SIFT算法已经找到了若干个匹配的点了(几十个甚至上百个),那么应该选择哪四个点来计算Homography matrix呢? RANSAC算法巧妙的解决了这一问题。
④Random sample consensus:RANSAC 随机抽样一致算法
It can effectively eliminate points with large errors, and these points are not included in the calculation of the model.
RANSAC excludes some data points in each calculation, which plays the role of eliminating their noise, and calculates the model on this basis.
Therefore, after obtaining a large number of matching points, RANSAC algorithm is used to select four random points at a time, and then the H matrix is obtained, and the iteration continues until the optimal H matrix is obtained.
说到估算模型的算法,很容易想到最小二乘法。最小二乘法在数据误差比较小的情况下是可以的,但是针对噪声很大的数据集的时候,容易出问题,我们可以通过下面的例子来说明
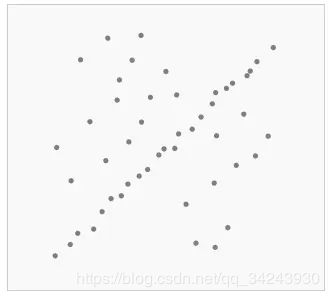
很明显,我们的数据应该是一条由左下到右上的一条线,但是由于离群数据太多(左上和右下区域),如果用最小二乘法的话,就无法准确的找到我们期望的模型(因为最小二乘法无法剔除误差很大的点,一视同仁的将所有的点都用于模型的计算)。RANSAC(Random Sample Consensus)算法的不同之处就在于,它能够有效的去除误差很大的点,并且这些点不计入模型的计算之中。该算法的框架如下:
在数据中随机的选择几个点设定为内群(也就是用来计算模型的点)
用这些选择的数据计算出一个模型
把其它刚才没选到的点带入刚才建立的模型中,计算是否为内群(也就是看这些点是否符合模型,如果符合模型的话,将新的点也计入内群)
如果此时的内群数量足够多的话,可以认为这个模型还算OK,那么就用现在的内群数据重新计算一个稍微好些的模型。
重复以上步骤,最后,我们保留那个内群数量最多的模型。
可以看到,RANSAC利用其独有的方式,在每一次的计算中都将一些数据点排除在外,起到了消除它们噪声的作用,并在此基础上计算模型。
所以,在得到了众多的匹配点以后,使用RANSAC算法,每次从中筛选四个随机的点,然后求得H矩阵,不断的迭代,直到求得最优的H矩阵为止。所以在前面使用cv2.findHomography方法时,参数cv2.RANSAC表明使用RANSAC算法来筛选关键点
import cv2
H, status = cv2.findHomography(ptsA,ptsB,cv2.RANSAC,reprojThresh)
#其中H为求得的单应性矩阵矩阵
#status则返回一个列表来表征匹配成功的特征点。
#ptsA,ptsB为关键点
#cv2.RANSAC
#ransacReprojThreshold 则表示一对内群点所能容忍的最大投影误差
#Maximum allowed reprojection error to treat a point pair as an inlier (used in the RANSAC method only)
误差计算公式
![]()
⑤application 应用
After OpenCV provides the above basic methods, we can use these methods to match images.
Firstly, feature points in img1 and img2 are found, and then a better matching point pair is found. Finally, image img2 is projected and mapped by warpPerspective method. The calculation formula is as follows:

在OpenCV提供了上述基础方法以后,我们可以利用这些方法来对图像进行匹配。
def siftImageAlignment(img1, img2):
   _, kp1, des1 = sift_kp(img1)
   _, kp2, des2 = sift_kp(img2)
   goodMatch = get_good_match(des1, des2)
   if len(goodMatch) > 4:
       ptsA= np.float32([kp1[m.queryIdx].pt for m in goodMatch]).reshape(-1, 1, 2)
       ptsB = np.float32([kp2[m.trainIdx].pt for m in goodMatch]).reshape(-1, 1, 2)
       ransacReprojThreshold = 2
       H, status =cv2.findHomography(ptsA, ptsB, cv2.RANSAC, ransacReprojThreshold);
       imgOut = cv2.warpPerspective(img2, H, (img1.shape[1],img1.shape[0]),flags=cv2.INTER_LINEAR + cv2.WARP_INVERSE_MAP)
   return imgOut, H, status
上面的函数首先找出img1和img2中的特征点,然后找到较好的匹配点对,最后通过warpPerspective方法对图像img2进行投影映射。其计算公式如下:
![]()
其中:
第一个参数为需要投影的图像(img2)
第二个参数为单应性矩阵(H)
第三个参数为所得图像的矩阵大小((img1.shape[1],img1.shape[0]) )
最后的参数cv2.INTER_LINEAR + cv2.WARP_INVERSE_MAP,为插值时使用的插值方法INTER_LINEAR,cv2.WARP_INVERSE_MAP则将M设置为dst—>src的方向变换。
def siftResult(num):
    img1 = cv2.imread('%s-1.jpg' % num)
    img2 = cv2.imread('%s-2.jpg' % num)

    result,_,_ = siftImageAlignment(img1,img2)

    # w,h,_ = img1.shape
    # img2 = cv2.resize(img2,(h,w))
    # print('img1:',img1.shape)
    # print('img2:',img2.shape)

    # allImg = np.concatenate((img1,img2,result),axis=1)
    # cv2.namedWindow('Result',cv2.WINDOW_NORMAL)
    # cv2.imshow('Result',allImg)

    cv2.imwrite('result.jpg', result)
    cv2.waitKey(0)
%调用函数
siftResult('1')
Step3. find differences (Matlab)
找不同
①Matlab-mark_butterfly.m
Call the ‘mark_butterfly’ function to return the location of the butterfly.
调用’mark_butterfly’函数返回蝴蝶的位置。
clear all;
picnum='4';
I=imread(sprintf('%s-1.jpg',picnum));
%figure(1),subplot(211),imshow(I);

%mark_butterfly
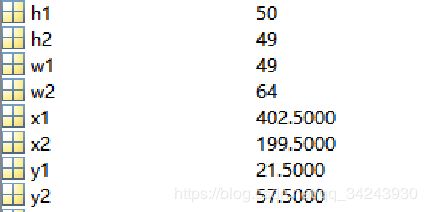
[x1,y1,w1,h1]=mark_butterfly(sprintf('%s-1.jpg',picnum),'butterfly.jpg');
[x2,y2,w2,h2]=mark_butterfly(sprintf('%s-2.jpg',picnum),'butterfly.jpg');
%figure(9),rectangle('position',[x1,y1,w1,h1],'EdgeColor','r','LineWidth',1)
%figure(9),rectangle('position',[x2,y2,w2,h2],'EdgeColor','r','LineWidth',1)
②Python-cvsift.py
Call the ‘cvsift.py’ to get the pixel-aligned image.
调用’cvsift.py’,得到像素对齐的图像。
%调用python模块
N = py.str(picnum)
py.cvsift.siftResult(N)
sift_result=imread('result.jpg');
%figure(1),subplot(212),imshow(sift_result);
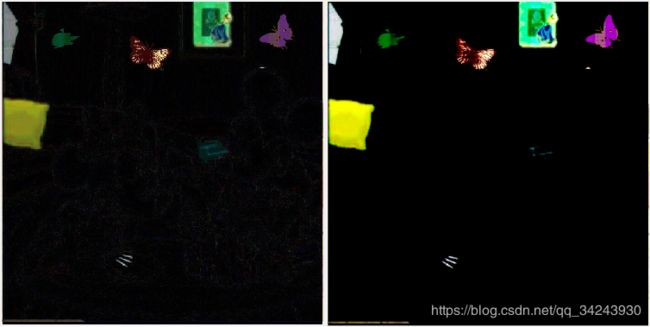
③Image subtraction 图像减法
If you subtract two images, you’re going to get a negative number, and if you just set it to 0, you’re going to lose a lot of information.
So we subtract from each other and then add.
如果你两幅图像相减,可能会得到负数,负数会被直接置为0,你会失去很多信息。
所以互相相减,然后相加。
%Image subtraction
I_sub=imsubtract(I,sift_result);
%figure(2),subplot(131),imshow(I_sub);

I_sub2=imsubtract(sift_result,I);
%figure(2),subplot(132),imshow(I_sub2);

I_sub_result=imadd(I_sub,I_sub2);
%figure(2),subplot(133),imshow(I_sub_result);
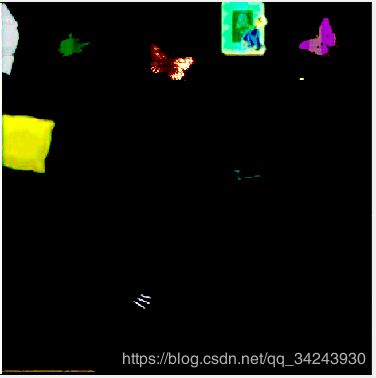
④Gray level transformation(imadjust) 灰度变换
The effect of low gray value pixels was removed and the high gray value pixels were enhanced.
去除低灰度值像素的影响,增强高灰度值像素。
About: imadjust
imadjust函数是MATLAB的一个工具箱函数,一般的语法调用格式为:
f1=imadjust(f,[low_in high_in],[low_out high_out],gamma)
(注:本文所述图像数据均为Uint8,对于Matlab,矩阵中的一个元素即是一个像素点)
该函数的意义:把图像f 灰度变换到新图像f1的过程中,f 中灰度值低于low_in的像素点在f1中灰度值被赋值为low_out,同理,f中灰度值高于high_in的像素点变换到f1时其灰度值也被赋值为high_out;
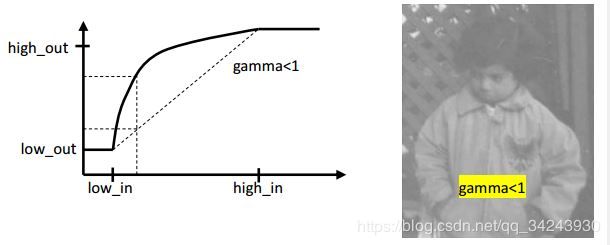
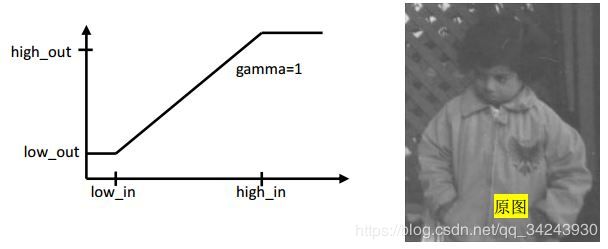
而对于参数gamma,
当gamma<1时,灰度图像靠近low_in的灰度值较低像素点灰度值变高,其灰度变化范围被拉伸,灰度值靠近high_in的一端灰度变化范围被压缩,图像整体变明亮。
同理,当gamma>1时,则灰度图像的靠近low_in的灰度值较低像素点灰度值变低,其灰度变化范围被压缩,灰度值靠近high_in的一端的灰度变化范围被拉伸.
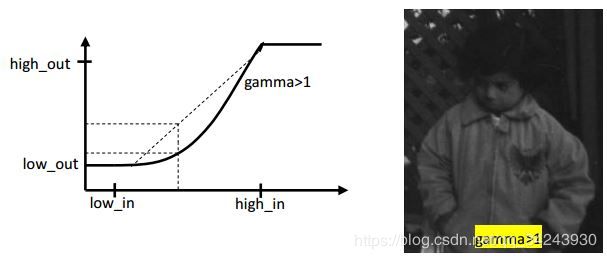
%灰度变换
g=imadjust(I_sub_result,[0.2 0.6], [0 1],0.5);
%figure(3),imshow(g);
⑤Median filter 中值滤波
denoising
去噪
After gray scale transformation, there are still small noise points in the image, so the median filter is used to process the image denoising.
经过灰度变换后,图像中仍然存在较小的噪声点,因此采用中值滤波对图像进行去噪处理。
%中值滤波
I1=g(:,:,1);
I2=g(:,:,2);
I3=g(:,:,3);
Y1=ordfilt2(I1,5,ones(3,3));
Y2=ordfilt2(I2,5,ones(3,3));
Y3=ordfilt2(I3,5,ones(3,3));
Z(:,:,1)=Y1;
Z(:,:,2)=Y2;
Z(:,:,3)=Y3;
%figure(4),imshow(Z);
⑥region morphology 区域形态学
%图像二值化Image binarization
thresh = 0.1; %二值化阈值
BW = im2bw(Z,thresh); %对图像二值化
%figure(5),imshow(BW);

BWA= bwareaopen(BW,15);%删除二值图像中像素小于15的对象
%figure(6),imshow(BWA);
像素归一化
[a,b]=size(BWA);%Normalization of image size
IBWA = imresize(BWA,[sqrt(250000*a/b) sqrt(250000*b/a)],'bilinear');
I_resize=imresize(I,[sqrt(250000*a/b) sqrt(250000*b/a)],'bilinear');
去边界(step2旋转的影响)
%去边界,防止旋转的影响Delete the border to prevent the effects of the rotation.
[m,n]=size(IBWA);
IBWA(1:9,1:n)=0;%上边界
IBWA(m-8:m,1:n)=0;%下边界
IBWA(1:m,1:9)=0;%左边界
IBWA(1:m,n-8:n)=0;%右边界
%figure(7),imshow(IBWA);

A1= imdilate(IBWA,strel('disk',6));%膨胀
%figure(8),imshow(A1);
⑦labeling 标记
Before the extraction of connected components, you need label the connected components .
在提取连通域之前,需要对连通域进行标记。
figure(9),imshow(I_resize);

[L,num]=bwlabel(A1,8); % 连通域标记
stats=regionprops(L,'boundingbox','Area','Centroid');
rects=cat(1,stats.BoundingBox);%包含相应区域的最小矩形
⑧extraction of connected components 连通域提取
Remove the connected areas of butterfly position and mark different places.
移除蝴蝶位置的连接区域,并标记不同的位置
for i=1:num
    [r c]=find(L==i);
     %figure(8),text(mean(c),mean(r),num2str(i),'Color', 'r');
     if(w1>0||w2>0)
         stats(i).Centroid
         if ((stats(i).Centroid(1)x1)&&(stats(i).Centroid(2)y1))...
             ||((stats(i).Centroid(1)x2)&&(stats(i).Centroid(2)y2))
            continue
         end
     end
     figure(9),rectangle('position',rects(i,:),'EdgeColor','r','LineWidth',1);
end
Result
reference
imadjust从用法到原理—Matlab灰度变换函数之一 :https://www.cnblogs.com/ggYYa/p/6007385.html
Python进行SIFT图像对准:
https://www.jianshu.com/p/f1b97dacc501
Matlab下调用Python接口:
https://blog.csdn.net/u011501388/article/details/78504894
sift特征源码(opencv):
https://www.cnblogs.com/Key-Ky/p/5909452.html
SIFT在OpenCV中的调用和具体实现:
http://www.cnblogs.com/jsxyhelu/p/7628664.html
matlab连通域处理函数:
matlab函数bwareaopen──删除小面积对象
https://www.cnblogs.com/nktblog/archive/2012/06/07/2540336.html
opencv: 颜色空间转换(cv2.cvtColor) 探究(图示+源码):
https://blog.csdn.net/jningwei/article/details/77725559
SIFT matlab源代码解析:
https://blog.csdn.net/joyce19920920/article/details/43644821
Python OpenCV cv2.xfeatures2d.SIFT_create detectAndCompute方法:
https://blog.csdn.net/yzxnuaa/article/details/79221174
AttributeError: ‘module’ object has no attribute ‘xfeatures2d’?:
https://stackoverflow.com/questions/48328365/attributeerror-module-object-has-no-attribute-xfeatures2d
opencv-contrib-python安装
https://blog.csdn.net/a19990412/article/details/80933680


