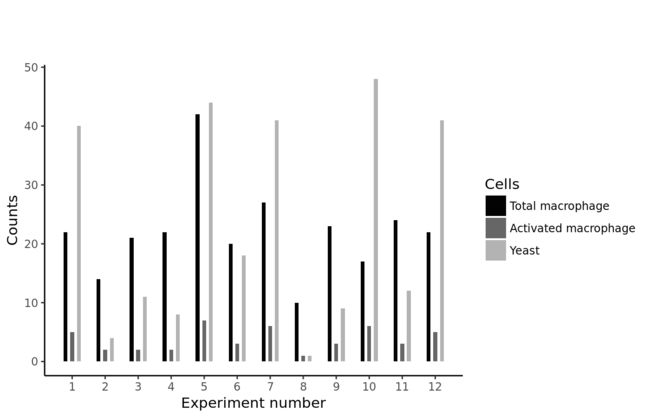
巨噬细胞吞噬实验作图:
# 原始数据输入
total_m <- c(22, 14, 21, 22, 42, 20, 27, 10, 23, 17, 24, 22)
activated_m <- c(5, 2, 2, 2, 7, 3, 6, 1, 3, 6, 3, 5)
yeast <- c(40, 4, 11, 8, 44, 18,  41, 1, 9, 48, 12, 41)
# 横坐标创建
seq1 <- seq(from=1, by=6, along.with=total_m)
seq2 <- seq1+1.2
seq3 <- seq2+1.2
# 构建ggplot作图数据
data1 <- data.frame(Counts=c(total_m, activated_m, yeast), Cells=factor(rep(c("Total macrophage", "Activated macrophage", "Yeast"), each=length(yeast)), levels=c("Total macrophage", "Activated macrophage", "Yeast")))
# 自定义颜色
cbbPalette <- c("gray1", "gray40", "gray70")

# pdf("/mnt/e/tmp.pdf", width=1400, height=900)
# png("/mnt/e/tmp.png", width=1400, height=900, res=200, type="cairo")
library(ggplot2)
p <- ggplot(data1, aes(x=c(seq1, seq2, seq3), y=Counts, fill=Cells), color="white")
p <- p + geom_bar(stat="identity", width=0.7)
p <- p+xlab("Experiment number")+scale_x_continuous(breaks=seq2, labels=seq(from=1, by=1, along.wit=seq2))+scale_color_manual(values=cbbPalette)
p <- p+scale_fill_manual(values=cbbPalette)+ theme_classic() + ggtitle("\n\n")
p + theme_classic()

# dev.off()
# 输出表格
data2 <- data.frame(tm=total_m, am=activated_m, y=yeast, ratio1=activated_m/total_m, ratio2=yeast/activated_m)
rownames(data2) = seq(1, by=1, length=nrow(data2))
write.table(file="/mnt/e/1.xls",as.matrix(data2), sep="\t")
