什么是动量?
说到动量,大家的第一反应(尤其是工科男)基本就是高中物理课本里提到的动量。呃,课本是找不着了,维基中这样描述:在经典力学里,动量(momentum)是物体的质量和速度的乘积,_公式:p=mv。
股票市场、汇率市场等其实都可以套用价格的动量法则,诺奖得主尤金·法玛(Eugene F.Fama)提出三因子模型距今已有20多年了,学术界在此基础上挖掘出更多的有效因子,动量因子当属第一。做交易当然得严谨,近年也有一篇题为《[Demystifying Managed Futures]》的论文提供了很好的理论基础。
昨日偶然看到一篇文章《Momentum Trading - A Price Action Trading Guide》,讲述通过观察K线来发现动量趋势并进行交易,觉得不错,现截取部分翻译后分享给大家。
摘要
1. 动量可用于任何时间框架,大到上百个交易日(甚至更长),小到单个k线图。
2. 物体的动量大小取决于质量和速度两要素,从单个K线图来看,如果将质量m比作K线图,那么K线图影线的长短就是质量m的大小;同样的,强动量的K线图的数量多少可以看成是速度v的大小;影线越短、K线柱体越长、强动量K线越多则量能越大。
3. 通过查看高动量K线的多少来简单初判趋势。
4. 结合布林线、阻力线、支撑线的高动量价格突破来提高判断价格走势的概率。
5. 动量分析具有普适性。
内容翻译与解读
What is momentum?
什么是动量?
> First of all, we need to understand what momentum actually means but this is straight forward.
> Momentum = Trend strength
> Momentum = Strong candlesticks
首先,我们需要理解动量的真正含义。动量可以是趋势强度,也可以是强势的K线图(可大可小)。
> So there are two ways of looking at momentum. The first one just looks at the overall trend strength and when price is in a trend, traders say that the momentum is bullish or bearish (in a downtrend). When we come to the micro level later, we will see that momentum also exists when we just look at individual candlesticks. A long candlestick without wicks (shadows) usually is considered a high momentum candlestick; candlestick with a small body and long wicks has no momentum.
因此, 动量有两种方式:第一种只是看整体趋势强度, 当价格呈现趋势时, 看涨或看跌。第二种进入微观层面时,我们将看到动量也存在于单个K线图里。 一个长柱体且没有影线的K线通常被认为具有高动量; 带有短柱体和长影线的K线则意味着缺乏动量。
> Below are three examples:
> A trend with strong bullish momentum first but then the momentum ‘faded’ (became weaker).
> A price chart with no momentum. Price is just going up and down without any direction or strength.
> A market where price went from strong bullish momentum to strong bearish momentum. At the top, price suddenly turned with, so called, momentum candles.
以下是三个例子(下图):
1. 一个强劲的看涨势头, 然后势头"消退";
2. 没有动量的价格波动,价格只是上上下下没有任何方向和力量;
3. 价格从强劲的看涨势头转向强劲的看跌势头。在顶部出现一个谓之为动量k线,价格自此突然转向。
图片引用见左下角水印
Following and understanding momentum
跟随与理解动量
> First (1), we are in a strong uptrend where price trended close to the outer Bollinger Bands®.
首先,下图① 价格沿着布林线外轨运动,处于一个强劲的上升趋势。
> Then (2) price entered a regular consolidation after the first trend wave. This is a normal behavior during trends and price never broke the 20 period SMA.
然后,下图② 价格在第一波趋势后进入常规整理阶段。趋势和价格没有突破20周期SMA中轨,这是一个正常的行为。
> At the top (3) price then reversed stronger. Here we then saw a strong sequence of 3 bearish candlesticks. This was the first time in a long time where price showed such strong bearish momentum. This should have caught your attention because something in the price dynamics had changed.
下图③ 到达价格的最高点后出现强势反转。 在这里我们看到了一组3个强劲的看跌k线,这是长期以来首次出现如此强劲的下跌势头。 这应引起注意, 因为价格态势的某些方面已经发生了变化。
> Once price broke the 20 SMA (4), even more selling entered and momentum showed that price is indeed now entering a downtrend.
下图④ 一旦价格突破20周期SMA中轨, 随着更多卖盘的涌入,种种迹象显示价格正处于下降趋势。
> Just by looking at how many bullish vs. bearish candles you can see and how it relates to the 20 SMA, you can gain SO many insights into a price chart and what is going on.
只要观察有多少看涨和看跌k线, 以及它与20SMA中轨的关系, 你就可以在价格表中洞察到很多信息和正在发生什么。
Candle analysis – Follow-through momentum and micro-momentum
K线分析
> As I said above, just comparing how many bullish vs. bearish candlesticks you have and how strong they are, you can gain a deep understanding of price charts.
正如我上面所说的, 只要比较一下有多少看涨与看跌k线以及它们的强度, 你就可以对价格图表有一个深刻的理解。
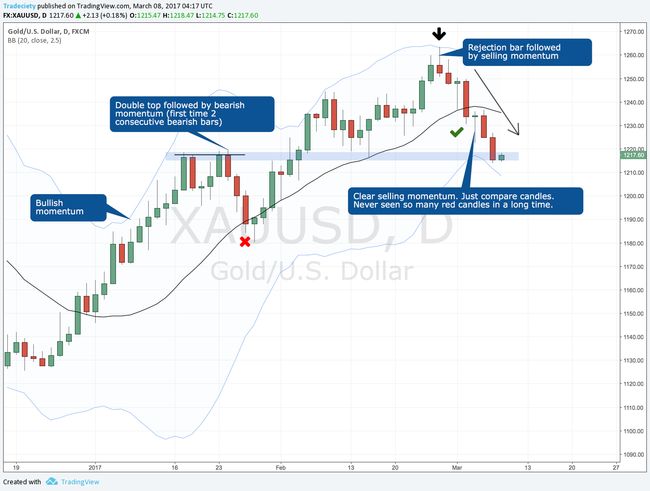
> Let’s take a final look at a different price chart and what we can make out of it by looking at price action alone.
让我们最后看看另一个价格图表, 我们可以单独看价格变动来解决问题。(在实操中应结合价格、交易量等多种指标综合判断,这里作者只是运用价格变动简单举例。)
> First, it starts off with a strong uptrend; price is close to the outer Bollinger Bands® and there are no bearish candles.
首先, 价格处于一个强劲的上升趋势,接近布林线外轨且没有看跌k线。
> Then we see the first consolidation and the first time that there is more than one consecutive bearish bar. On the lower timeframes, this could have been traded nicely back to the 20 SMA.
然后我们看到了第一个价格整理,第一次出现多个连续的看跌K线。 在较低的时间框架内, 这个价格可能会处于20 SMA中轨以上。
> Price continues its rally afterwards but we never have more than one consecutive bearish bar until price spikes into the Bollinger Bands® and leaves the pinbar. Now we see multiple bearish candlesticks and the bulls are not able to fight back. Price even breaks the 20 SMA with a high momentum candle and then continues the downtrend further. You can see how the shift in momentum was very obvious at the top with the 2 bearish candles and the pinbar.
之后, 价格继续上涨, 没有一个连续的看跌K线, 直到一个较大幅度的下跌为止。 现在我们看到了多个看跌的K线, 多头无力反击。 一个高动量K线甚至跌破了20SMA中轨, 然后延续下降趋势。 你可以在顶部通过看跌K线发现非常明显的动量变化。
More usage examples: Breakout momentum
更多实用例子: 动量突破
> Momentum can not only be used for trend and reversal trading, but it can also help you find high probability breakouts.
动量不仅可以用于趋势交易和反转交易, 它也可以帮助你找到高成功率的突破。
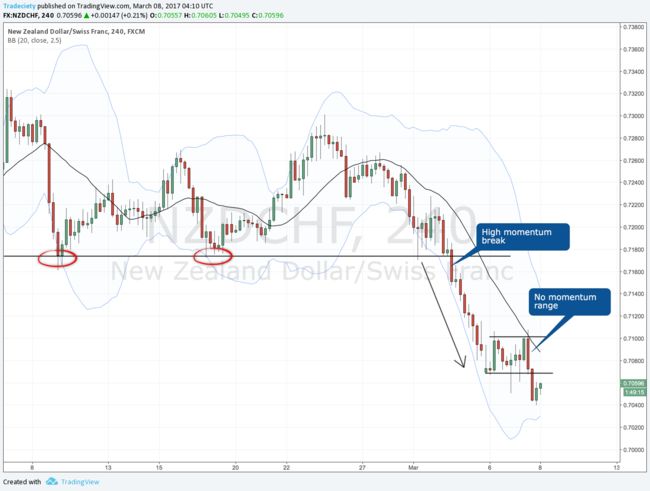
> I like to draw support and resistance levels are high impact areas, especially after long and exhausted trends, and then wait for a high momentum break of such a level.
我喜欢画支撑和阻力线,这是一个高效的区域, 特别是在长期疲软的趋势之后, 然后等待一个高动量来突破这样一个水平。
> The screenshot below shows a recent trade of mine where the NZD/JPY was in a long range with a clear support level. Price rejected the level multiple times but once we had the high momentum breakout, it never looked back.
下面的截图显示了我最近的一个交易, 新元/ 日元 在长期范围内有一个明确的支撑水平。 价格多次近乎触及这个水平, 但是一旦价格有了高动量的突破, 它就一去不复返。
> This also works nicely with trendlines and high momentum breaks at strong trendlines can be a great signal as well.
这也很好地适用于趋势线,强趋势线的高动量突破也是一个很重要的信号。
Right now: USD/CAD fading momentum
现在,让我们看下美元 / 加元的衰落动量
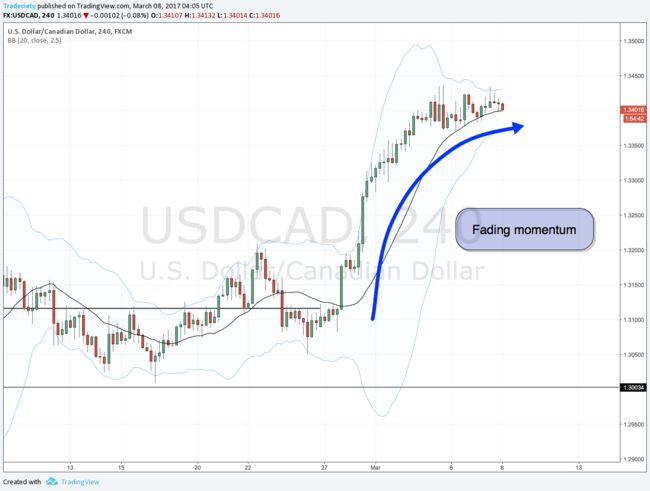
> The screenshot shows the USD/CAD 4H chart which many traders are looking at. Price trended nicely higher but recently, the momentum got weaker and price ‘rounded off’.
截图显示了许多交易员正在使用的美元 / 加元 4H 图表。 价格开始走高, 但最近,量能变得越来越弱, 价格越来越低。
> This can mean one of three signs:
> 1. The trend is losing strength and continues to trade sideways
> 2. The trend is losing strength and going to reverse
> 3. The trend is just pausing and then continues higher
这可能意味着三种迹象:这种趋势正在失去能量,并继续横向交易;这种趋势正在失去能量而且正在逆转;这种趋势只是暂停一会,然后继续上升。
> Most people make the mistake in their trading that they don’t wait for the final momentum signal. If I am looking to sell the USD/CAD, I will wait until I can see a clear high momentum bearish bar or sequence that confirms price is actually going lower.
大多数人在交易中犯了错误, 他们没有等待最后的动量信号。 如果我想出售美元 / 加元, 我会等到一个或多个清晰的高动量的看跌K线, 确认价格实际上正在下降。
> Amateurs will try to forecast a move and then either buy or sell as long as price is still in this range; this is a low probability trade and predicting is not going to work.
小散会根据主观判断买进或卖出,但判断准确的概率很低, 预测是行不通的。
> As you can see, momentum analysis is a great way of looking at charts and it should be used by all traders, regardless of their style.
正如你所看到的, 动量分析是一个很好的观察图表的方式, 它应该被广泛的交易者所使用, 不管他们的风格如何。
总结
动量分析具有很强的普适性,普通交易者通过价格动量再结合其他指标工具即可提升交易成功的概率,简直就是缺乏信息优势的小散跟随趋势操作的利器。
原文链接:[ Momentum Trading - A Price Action Trading Guide - Tradeciety Trading Academy ]
免责声明:本文不够成任何投资建议。


