1.画图
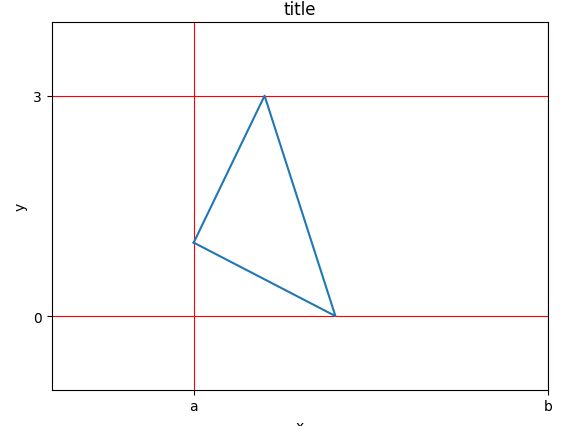
import matplotlib.pyplot as plt

x = [1,2,3,1]
y = [1,3,0,1]

plt.plot(x,y)

plt.title('title')#标题
plt.ylabel('y')#纵轴的显示
plt.xlabel('x')#横轴的显示

plt.xticks([1,3])#x轴的显示数据
plt.yticks([0,3])#y轴的显示数据
plt.xticks([1,6],['a','b'])#用a,b代替1,6显示

plt.ylim([-1,4])#y显示的范围
plt.xlim([-1,6])#x显示的范围

plt.grid(True,color='r')#不带color参数是默认黑色
plt.show()
画图样式
数据线的样式设置
颜色缩写 全程
b blue
c cyan#青色
g green
k black
m magenta#紫红色
r red
w white
y yellow
线性缩写 含义
-- --虚线
-. -.虚线
: .虚线
- 实线
plot, figure, subplot
plot
这个函数比较常用,可以看看文档,就可以了,记得就是默认一个参数下,就是y的坐标
figure
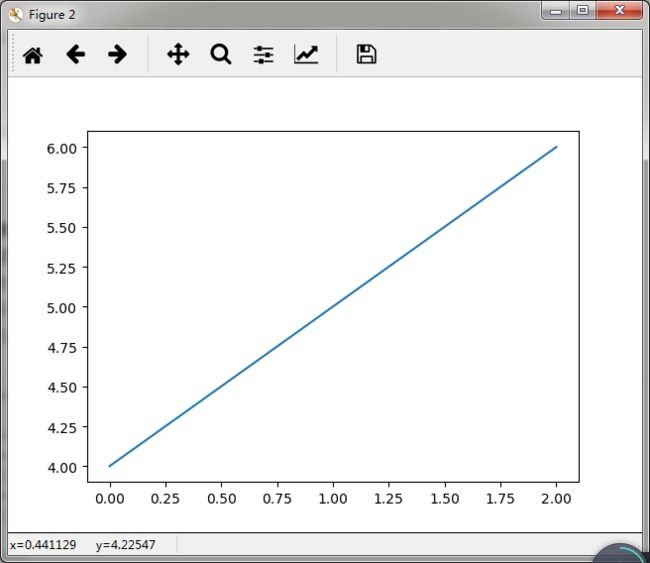
作用新建绘画窗口,独立显示绘画的图片
subplot
这个比较重要,需要重点掌握,参数有r,c,n三个参数
使用这个函数的重点是将多个图像画在同一个绘画窗口.
r 表示行数
c 表示列行
n 表示第几个
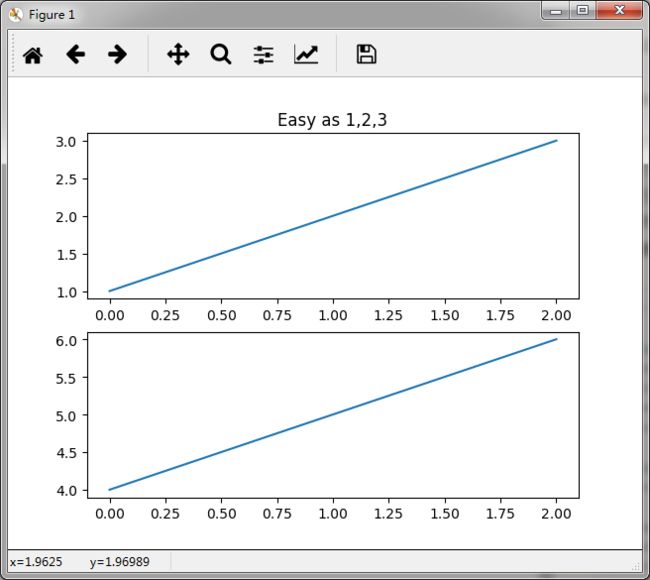
import matplotlib.pyplot as plt

plt.figure(1)
plt.subplot(211)
plt.plot([1, 2, 3])
plt.subplot(212)
plt.plot([4, 5, 6])

plt.figure(2)
plt.plot([4, 5, 6])

plt.figure(1)
plt.subplot(211)
plt.title('Easy as 1,2,3')
plt.show()
由显示应该能看懂这三个的意思
散点图
import matplotlib.pyplot as plt

x = [1,2,3,10]
y = [1,3,0,10]

plt.scatter(x,y)
#plt.autoscale(tight=True) #自动布局 点在边缘上  自己试试就知道自己的数据适不适合用这个
plt.show()
下面是自动布局的:
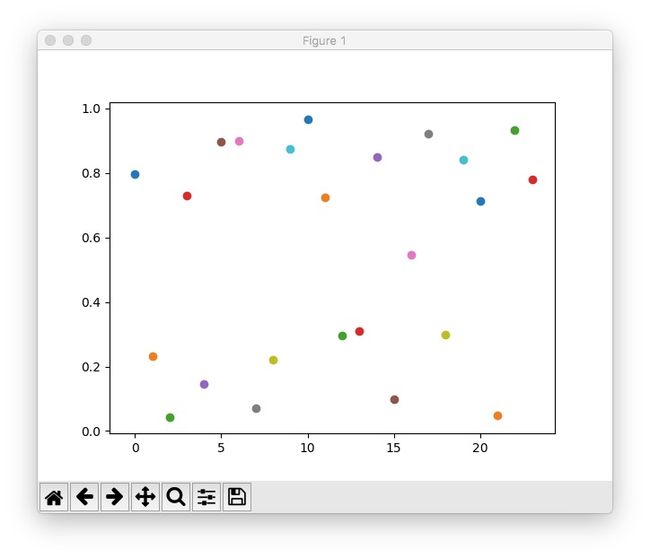
动态图
import matplotlib.pyplot as plt
import numpy as np
plt.axis([0,50,0,1])
plt.ion()#动态图的交互模式打开   此时show()不再暂停
for i in range(50):
    y = np.random.random()#0-1
    plt.scatter(i,y)
    plt.pause(0.01)
    plt.autoscale()
    plt.show()
plt.pause(1000)
--!动态图不会截QAQ
Latex书写
import matplotlib.pyplot as plt
fig = plt.figure() #figsize=(10,6)
ax= fig.add_subplot(111)
ax.set_xlim([1, 6])
ax.set_ylim([1, 9])
#如果写失败   很可能是多了空格  比如r'$ \mu \alpha‘  就显示不出来。。恶心啊
ax.text(2, 8,  r'$\mu\alpha\tau\pi\lambda\omega\tau\lambda\iota\beta$',fontsize=20)
ax.text(3,7,r'$\alpha =\frac{1}{2}\ln(\frac{1-\varepsilon}{\varepsilon })$')
ax.text(2, 6, r"$ \lim_{x \rightarrow 0} \frac{1}{x} $",fontsize=20)
ax.text(2, 4, r"$a\ \leq\ b\ \leq\ c\ \Rightarrow\ a\leq\ c$",fontsize=20)
ax.text(2, 2, r"$ \sum_{i=1}^{\infty}\ x_i^2$",fontsize=20)
ax.text(4, 8, r"$ \sin(0) = \cos(\frac{\pi}{2})$",fontsize=20)
ax.text(4, 6, r"$ \sqrt[3]{x} = \sqrt{y}$",fontsize=20)
ax.text(2, 5, r"$\neg(a\wedge b)\Leftrightarrow\neg a\vee\neg b$")
ax.text(4, 2, r"$ \int_a^b f(x)dx$",fontsize=20)
plt.show()
好啦,今天就先这样吧。下次会带来柱形图的画法。
欢迎关注深度学习自然语言处理公众号


