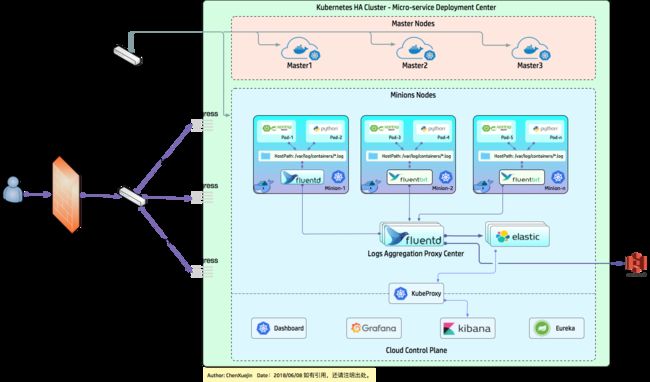
日志的Agent,我们使用的是Fluent Bit,原因还是那句:性能相较Fluentd稍好,消耗资源要少一些。但是鉴于Fluent Bit 的稳定性,有部分节点无法正常运行(有些是日志无法解析造成的,也有其它原因,由于太久没接触过C和C++,有时只能等待官方补丁),也有部分节点可能会运行一段时间崩溃的情况。所以对于日志要求比较高的场景,还是推荐使用Fluentd。 常见的Fluent Bit的异常,该异常是由于日志文件Json解析异常直接导致Fluent Bit崩溃,号称在0.13.3版本中解决,问题依旧:
[centos@master1 fluent-bit]$
[centos@master1 fluent-bit]$ kubectl logs -f fluent-bit-5kvpl -n kube-system
[2018/06/11 03:11:49] [ info] [engine] started (pid=1)
[2018/06/11 03:11:49] [ info] [filter_kube] https=1 host=kubernetes.default.svc.cluster.local port=443
[2018/06/11 03:11:49] [ info] [filter_kube] local POD info OK
[2018/06/11 03:11:49] [ info] [filter_kube] testing connectivity with API server...
[2018/06/11 03:11:49] [ info] [filter_kube] API server connectivity OK
[2018/06/11 03:11:49] [ info] [http_server] listen iface=0.0.0.0 tcp_port=2020
[engine] caught signal (SIGSEGV)
Fluent-Bit v0.13.2
Copyright (C) Treasure Data

#0  0x7fcc07f6eff1      in  ???() at ???:0
#1  0x55b0b655dede      in  msgpack_sbuffer_write() at lib/msgpack-2.1.3/include/msgpack/sbuffer.h:84
#2  0x55b0b6771ca5      in  msgpack_pack_ext_body() at lib/msgpack-2.1.3/include/msgpack/pack_template.h:890
#3  0x55b0b6771ca5      in  msgpack_pack_object() at lib/msgpack-2.1.3/src/objectc.c:72
#4  0x55b0b655e8c0      in  pack_map_content() at plugins/filter_kubernetes/kubernetes.c:321
#5  0x55b0b655f129      in  cb_kube_filter() at plugins/filter_kubernetes/kubernetes.c:493
#6  0x55b0b64feaea      in  flb_filter_do() at src/flb_filter.c:86
#7  0x55b0b64fc53c      in  flb_input_dbuf_write_end() at include/fluent-bit/flb_input.h:642
#8  0x55b0b64fe09c      in  flb_input_dyntag_append_raw() at src/flb_input.c:894
#9  0x55b0b6522b1d      in  process_content() at plugins/in_tail/tail_file.c:290
#10 0x55b0b6523968      in  flb_tail_file_chunk() at plugins/in_tail/tail_file.c:651
#11 0x55b0b6521357      in  in_tail_collect_static() at plugins/in_tail/tail.c:129
#12 0x55b0b64fe5db      in  flb_input_collector_fd() at src/flb_input.c:995
#13 0x55b0b6505370      in  flb_engine_handle_event() at src/flb_engine.c:296
#14 0x55b0b6505370      in  flb_engine_start() at src/flb_engine.c:515
#15 0x55b0b64a5606      in  main() at src/fluent-bit.c:824
#16 0x7fcc07e662e0      in  ???() at ???:0
#17 0x55b0b64a3a89      in  ???() at ???:0
#18 0xffffffffffffffff  in  ???() at ???:0
[centos@master1 fluent-bit]$
kind: ConfigMap
apiVersion: v1
metadata:
name: fluentd-sa-config-v0.1.4
namespace: kube-system
labels:
addonmanager.kubernetes.io/mode: Reconcile
data:
system.conf: |-
root_dir /tmp/fluentd-buffers/
containers.input.conf: |-
# This configuration file for Fluentd / td-agent is used
# to watch changes to Docker log files. The kubelet creates symlinks that
# capture the pod name, namespace, container name & Docker container ID
# to the docker logs for pods in the /var/log/containers directory on the host.
# If running this fluentd configuration in a Docker container, the /var/log
# directory should be mounted in the container.
#
# These logs are then submitted to Elasticsearch which assumes the
# installation of the fluent-plugin-elasticsearch & the
# fluent-plugin-kubernetes_metadata_filter plugins.
# See https://github.com/uken/fluent-plugin-elasticsearch &
# https://github.com/fabric8io/fluent-plugin-kubernetes_metadata_filter for
# more information about the plugins.
#
# Example
# =======
# A line in the Docker log file might look like this JSON:
#
# {"log":"2014/09/25 21:15:03 Got request with path wombat\n",
# "stream":"stderr",
# "time":"2014-09-25T21:15:03.499185026Z"}
#
# The time_format specification below makes sure we properly
# parse the time format produced by Docker. This will be
# submitted to Elasticsearch and should appear like:
# $ curl 'http://elasticsearch-logging:9200/_search?pretty'
# ...
# {
# "_index" : "logstash-2014.09.25",
# "_type" : "fluentd",
# "_id" : "VBrbor2QTuGpsQyTCdfzqA",
# "_score" : 1.0,
# "_source":{"log":"2014/09/25 22:45:50 Got request with path wombat\n",
# "stream":"stderr","tag":"docker.container.all",
# "@timestamp":"2014-09-25T22:45:50+00:00"}
# },
# ...
#
# The Kubernetes fluentd plugin is used to write the Kubernetes metadata to the log
# record & add labels to the log record if properly configured. This enables users
# to filter & search logs on any metadata.
# For example a Docker container's logs might be in the directory:
#
# /var/lib/docker/containers/997599971ee6366d4a5920d25b79286ad45ff37a74494f262e3bc98d909d0a7b
#
# and in the file:
#
# 997599971ee6366d4a5920d25b79286ad45ff37a74494f262e3bc98d909d0a7b-json.log
#
# where 997599971ee6... is the Docker ID of the running container.
# The Kubernetes kubelet makes a symbolic link to this file on the host machine
# in the /var/log/containers directory which includes the pod name and the Kubernetes
# container name:
#
# synthetic-logger-0.25lps-pod_default_synth-lgr-997599971ee6366d4a5920d25b79286ad45ff37a74494f262e3bc98d909d0a7b.log
# ->
# /var/lib/docker/containers/997599971ee6366d4a5920d25b79286ad45ff37a74494f262e3bc98d909d0a7b/997599971ee6366d4a5920d25b79286ad45ff37a74494f262e3bc98d909d0a7b-json.log
#
# The /var/log directory on the host is mapped to the /var/log directory in the container
# running this instance of Fluentd and we end up collecting the file:
#
# /var/log/containers/synthetic-logger-0.25lps-pod_default_synth-lgr-997599971ee6366d4a5920d25b79286ad45ff37a74494f262e3bc98d909d0a7b.log
#
# This results in the tag:
#
# var.log.containers.synthetic-logger-0.25lps-pod_default_synth-lgr-997599971ee6366d4a5920d25b79286ad45ff37a74494f262e3bc98d909d0a7b.log
#
# The Kubernetes fluentd plugin is used to extract the namespace, pod name & container name
# which are added to the log message as a kubernetes field object & the Docker container ID
# is also added under the docker field object.
# The final tag is:
#
# kubernetes.var.log.containers.synthetic-logger-0.25lps-pod_default_synth-lgr-997599971ee6366d4a5920d25b79286ad45ff37a74494f262e3bc98d909d0a7b.log
#
# And the final log record look like:
#
# {
# "log":"2014/09/25 21:15:03 Got request with path wombat\n",
# "stream":"stderr",
# "time":"2014-09-25T21:15:03.499185026Z",
# "kubernetes": {
# "namespace": "default",
# "pod_name": "synthetic-logger-0.25lps-pod",
# "container_name": "synth-lgr"
# },
# "docker": {
# "container_id": "997599971ee6366d4a5920d25b79286ad45ff37a74494f262e3bc98d909d0a7b"
# }
# }
#
# This makes it easier for users to search for logs by pod name or by
# the name of the Kubernetes container regardless of how many times the
# Kubernetes pod has been restarted (resulting in a several Docker container IDs).
# Json Log Example:
# {"log":"[info:2016-02-16T16:04:05.930-08:00] Some log text here\n","stream":"stdout","time":"2016-02-17T00:04:05.931087621Z"}
# CRI Log Example:
# 2016-02-17T00:04:05.931087621Z stdout F [info:2016-02-16T16:04:05.930-08:00] Some log text here
@id fluentd-containers.log
@type tail
path /var/log/containers/*.log
pos_file /var/log/es-containers.log.pos
time_format %Y-%m-%dT%H:%M:%S.%NZ
tag raw.kubernetes.*
read_from_head true
@type multi_format
format json
time_key time
time_format %Y-%m-%dT%H:%M:%S.%NZ
format /^(?
# Detect exceptions in the log output and forward them as one log entry.
@id raw.kubernetes
@type detect_exceptions
remove_tag_prefix raw
message log
stream stream
multiline_flush_interval 5
max_bytes 500000
max_lines 1000
system.input.conf: |-
# Example:
# 2015-12-21 23:17:22,066 [salt.state ][INFO ] Completed state [net.ipv4.ip_forward] at time 23:17:22.066081
@id minion
@type tail
format /^(?
# Example:
# Dec 21 23:17:22 gke-foo-1-1-4b5cbd14-node-4eoj startupscript: Finished running startup script /var/run/google.startup.script
@id startupscript.log
@type tail
format syslog
path /var/log/startupscript.log
pos_file /var/log/es-startupscript.log.pos
tag startupscript
# Examples:
# time="2016-02-04T06:51:03.053580605Z" level=info msg="GET /containers/json"
# time="2016-02-04T07:53:57.505612354Z" level=error msg="HTTP Error" err="No such image: -f" statusCode=404
# TODO(random-liu): Remove this after cri container runtime rolls out.
@id docker.log
@type tail
format /^time="(?
# Example:
# 2016/02/04 06:52:38 filePurge: successfully removed file /var/etcd/data/member/wal/00000000000006d0-00000000010a23d1.wal
@id etcd.log
@type tail
# Not parsing this, because it doesn't have anything particularly useful to
# parse out of it (like severities).
format none
path /var/log/etcd.log
pos_file /var/log/es-etcd.log.pos
tag etcd
# Multi-line parsing is required for all the kube logs because very large log
# statements, such as those that include entire object bodies, get split into
# multiple lines by glog.
# Example:
# I0204 07:32:30.020537 3368 server.go:1048] POST /stats/container/: (13.972191ms) 200 [[Go-http-client/1.1] 10.244.1.3:40537]
@id kubelet.log
@type tail
format multiline
multiline_flush_interval 5s
format_firstline /^\w\d{4}/
format1 /^(?\w)(?
例如,你想myuser使用mypassword从任何主机连接到mysql服务器的话。
GRANT ALL PRIVILEGES ON *.* TO 'myuser'@'%'IDENTIFIED BY 'mypassword' WI
TH GRANT OPTION;
如果你想允许用户myuser从ip为192.168.1.6的主机连接到mysql服务器,并使用mypassword作
在 Service Pack 4 (SP 4), 是运行 Microsoft Windows Server 2003、 Microsoft Windows Storage Server 2003 或 Microsoft Windows 2000 服务器上您尝试安装 Microsoft SQL Server 2000 通过卷许可协议 (VLA) 媒体。 这样做, 收到以下错误信息CD KEY的 SQ
OS 7 has a new method that allows you to draw a view hierarchy into the current graphics context. This can be used to get an UIImage very fast.
I implemented a category method on UIView to get the vi
方法一:
在my.ini的[mysqld]字段加入:
skip-grant-tables
重启mysql服务,这时的mysql不需要密码即可登录数据库
然后进入mysql
mysql>use mysql;
mysql>更新 user set password=password('新密码') WHERE User='root';
mysq
背景
2014年11月12日,ASP.NET之父、微软云计算与企业级产品工程部执行副总裁Scott Guthrie,在Connect全球开发者在线会议上宣布,微软将开源全部.NET核心运行时,并将.NET 扩展为可在 Linux 和 Mac OS 平台上运行。.NET核心运行时将基于MIT开源许可协议发布,其中将包括执行.NET代码所需的一切项目——CLR、JIT编译器、垃圾收集器(GC)和核心