参考生信技能树1以及生信技能树2
只记录从数据下载,到最终结果展示,具体生物学知识请自行查阅
稍后关于ChIP-seq的背景知识我会再发布一篇文章。
数据下载:数据存放地址
关于环境配置和软件安装请参考我之前的RNA-seq分析流程
-------------------------------------------
1 软件安装及环境配置
2 sra数据下载(采取aspera下载)
cd /mnt/f/Data/chip_seq/data
for ((i=204;i<=209;i++));do ascp -QT -v -i ~/.aspera/connect/etc/asperaweb_id_dsa.openssh -k 1 -T -l200m [email protected]:/sra/sra-instant/reads/ByRun/sra/SRR/SRR620/SRR620${i}/SRR620${i}.sra .;done
ls -lh *sra
-rwxrwxrwx 1 root root 522M Aug 14 10:03 SRR620204.sra
-rwxrwxrwx 1 root root 365M Aug 14 10:08 SRR620205.sra
-rwxrwxrwx 1 root root 572M Aug 14 10:19 SRR620206.sra
-rwxrwxrwx 1 root root 741M Aug 14 10:30 SRR620207.sra
-rwxrwxrwx 1 root root 346M Aug 14 10:37 SRR620208.sra
-rwxrwxrwx 1 root root 639M Aug 14 11:08 SRR620209.sra
3 sra到fastq格式转换并进行质量控制
3.1 用samtools中的fastq-dump将sra格式转为fastq格式
source ~/miniconda3/bin/activate
for ((i=204;i<=209;i++));do fastq-dump --gzip --split-3 -A SRR620$i -O .;done
ls -lh *fastq.gz
-rwxrwxrwx 1 root root 883M Aug 14 11:18 SRR620204.fastq.gz
-rwxrwxrwx 1 root root 703M Aug 14 11:24 SRR620205.fastq.gz
-rwxrwxrwx 1 root root 968M Aug 14 11:30 SRR620206.fastq.gz
-rwxrwxrwx 1 root root 1.4G Aug 14 11:41 SRR620207.fastq.gz
-rwxrwxrwx 1 root root 589M Aug 14 11:45 SRR620208.fastq.gz
-rwxrwxrwx 1 root root 1.1G Aug 14 11:54 SRR620209.fastq.gz
3.2 用fastqc进行质量控制
#将所有的数据进行质控,得到zip的压缩文件和html文件
fastqc -o .  *.fastq.gz
4 Bowtie2进行序列比对
下载小鼠index文件并解压(迅雷下载)
unzip mm10.zip
unzip mm10.zip
Archive:  mm10.zip
  inflating: mm10.1.bt2
  inflating: mm10.2.bt2
  inflating: mm10.3.bt2
  inflating: mm10.4.bt2
  inflating: mm10.rev.1.bt2
  inflating: mm10.rev.2.bt2
  inflating: make_mm10.sh
cd /mnt/f/Data/chip_seq/data
bowtie2 -p 6 -3 5 --local -x /mnt/f/Data/reference/bowtie2_index/mm10 -U SRR620204.fastq.gz | samtools sort -O bam -o ../aligned/ring1B.bam &
19687027 reads; of these:
  19687027 (100.00%) were unpaired; of these:
    7778437 (39.51%) aligned 0 times
    7766495 (39.45%) aligned exactly 1 time
    4142095 (21.04%) aligned >1 times
60.49% overall alignment rate
[bam_sort_core] merging from 4 files and 1 in-memory blocks...
bowtie2 -p 6 -3 5 --local -x /mnt/f/Data/reference/bowtie2_index/mm10 -U SRR620205.fastq.gz | samtools sort -O bam -o ../aligned/cbx7.bam &
20710168 reads; of these:
  20710168 (100.00%) were unpaired; of these:
    2584870 (12.48%) aligned 0 times
    10914615 (52.70%) aligned exactly 1 time
    7210683 (34.82%) aligned >1 times
87.52% overall alignment rate
[bam_sort_core] merging from 4 files and 1 in-memory blocks...
bowtie2 -p 6 -3 5 --local -x /mnt/f/Data/reference/bowtie2_index/mm10 -U SRR620206.fastq.gz | samtools sort -O bam -o ../aligned/suz12.bam &
21551927 reads; of these:
  21551927 (100.00%) were unpaired; of these:
    7109852 (32.99%) aligned 0 times
    9455003 (43.87%) aligned exactly 1 time
    4987072 (23.14%) aligned >1 times
67.01% overall alignment rate
[bam_sort_core] merging from 4 files and 1 in-memory blocks...
bowtie2 -p 6 -3 5 --local -x /mnt/f/Data/reference/bowtie2_index/mm10 -U SRR620207.fastq.gz | samtools sort -O bam -o ../aligned/RYBP.bam &
39870646 reads; of these:
  39870646 (100.00%) were unpaired; of these:
    6312903 (15.83%) aligned 0 times
    20702502 (51.92%) aligned exactly 1 time
    12855241 (32.24%) aligned >1 times
84.17% overall alignment rate
[bam_sort_core] merging from 8 files and 1 in-memory blocks...
bowtie2 -p 6 -3 5 --local -x /mnt/f/Data/reference/bowtie2_index/mm10 -U SRR620208.fastq.gz | samtools sort -O bam -o ../aligned/IgGold.bam &
13291429 reads; of these:
  13291429 (100.00%) were unpaired; of these:
    5608796 (42.20%) aligned 0 times
    4663584 (35.09%) aligned exactly 1 time
    3019049 (22.71%) aligned >1 times
57.80% overall alignment rate
[bam_sort_core] merging from 2 files and 1 in-memory blocks...
bowtie2 -p 6 -3 5 --local -x /mnt/f/Data/reference/bowtie2_index/mm10 -U SRR620209.fastq.gz | samtools sort -O bam -o ../aligned/IgG.bam &
31218866 reads; of these:
  31218866 (100.00%) were unpaired; of these:
    5370101 (17.20%) aligned 0 times
    15180537 (48.63%) aligned exactly 1 time
    10668228 (34.17%) aligned >1 times
82.80% overall alignment rate
[bam_sort_core] merging from 6 files and 1 in-memory blocks...
cd ../aligned
ls -lh *bam
-rwxrwxrwx 1 root root 623M Aug 14 23:53 cbx7.bam
-rwxrwxrwx 1 root root 999M Aug 14 23:56 IgG.bam
-rwxrwxrwx 1 root root 503M Aug 14 23:43 IgGold.bam
-rwxrwxrwx 1 root root 752M Aug 14 19:37 ring1B.bam
-rwxrwxrwx 1 root root 1.2G Aug 14 23:59 RYBP.bam
-rwxrwxrwx 1 root root 845M Aug 14 23:49 suz12.bam
5 用MACS2获取Chip-seq富集区
macs2 callpeak -c IgGold.bam -t suz12.bam -q 0.05 -f BAM -g mm -n suz12 &
macs2 callpeak -c IgGold.bam -t cbx7.bam -q 0.05 -f BAM -g mm -n cbx7 &
macs2 callpeak -c IgGold.bam -t ring1B.bam -q 0.05 -f BAM -g mm -n ring1B &
macs2 callpeak -c IgGold.bam -t RYBP.bam -q 0.05 -f BAM -g mm -n RYBP &
每个比较都会得到四个文件,如下
NAMEpeaks.xls: 以表格形式存放peak信息,虽然后缀是xls,但其实能用文本编辑器打开,和bed格式类似,但是以1为基,而bed文件是以0为基.也就是说xls的坐标都要减一才是bed文件的坐标
NAMEpeaks.narrowPeak NAMEpeaks.broadPeak 类似。后面4列表示为, integer score for display, fold-change,-log10pvalue,-log10qvalue,relative summit position to peak start。内容和NAMEpeaks.xls基本一致,适合用于导入R进行分析。
NAMEsummits.bed:记录每个peak的peak summits,也就是记录极值点的位置。MACS建议用该文件寻找结合位点的motif。
NAME_model.r,能通过NAME_model.r作图,得到是基于你提供数据的peak模型
- 注:RYBP无peak数据(RYBP_model.r可以用),手动下载peaks数据
wget ftp://ftp.ncbi.nlm.nih.gov/geo/series/GSE42nnn/GSE42466/suppl/GSE42466_RYBP_peaks_5.txt.gz
gzip -d GSE42466_RYBP_peaks_5.txt.gz
mv GSE42466_RYBP_peaks_5.txt RYBP_summits.bed
6 对peaks注释和可视化(R):Chipseeker包
6.0 安装并加载相应的R包,读入peak文件
source ("https://bioconductor.org/biocLite.R")
biocLite("ChIPseeker")
biocLite("TxDb.Mmusculus.UCSC.mm10.knownGene")
library("ChIPseeker")
library("org.Mm.eg.db")
library("TxDb.Mmusculus.UCSC.mm10.knownGene")
library("clusterProfiler")
txdb <- TxDb.Mmusculus.UCSC.mm10.knownGene
读入peak文件
setwd("F:/Data/chip_seq/aligned")
suz12<-readPeakFile("suz12_peaks.narrowPeak")
6.1 查看peak在全基因组的位置
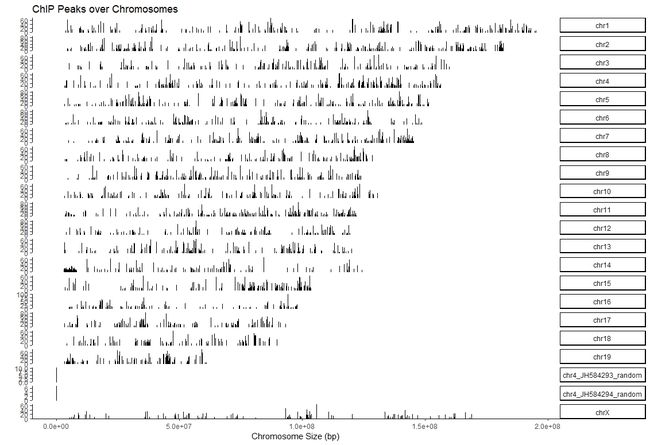
covplot函数可以计算peak 在染色体上的覆盖区域,并可视化。
covplot(suz12,weightCol=5)
备注:
使用Y叔CHIPseeker包说明书中的covplot(peak, weightCol="V5")提示一下错误:
Error in .normarg_shift_or_weight(weight, "weight", x) :
  'weight' must be a numeric vector, a single string, or a list-like object
我直接把v去掉了,显示结果和说明书中一致。
还可以定义具体的染色体(图就不展示了)
covplot(suz12, weightCol=5, chrs=c("chr4", "chr5"), xlim=c(4.5e7, 5e7))
6.2 ChIP peaks结合TSS 区域的情况
- TSS:transcription start site
- 首先,计算ChIP peaks结合在TSS区域的情况。这就需要准备TSS区域,这一般定义在TSS位点的侧翼序列(默认-3000~+3000)。然后比对 map到这些区域的peak,并生成tagMatrix。
promoter <- getPromoters(TxDb=txdb, upstream=3000, downstream=3000)
tagMatrix <- getTagMatrix(suz12, windows=promoter)
-
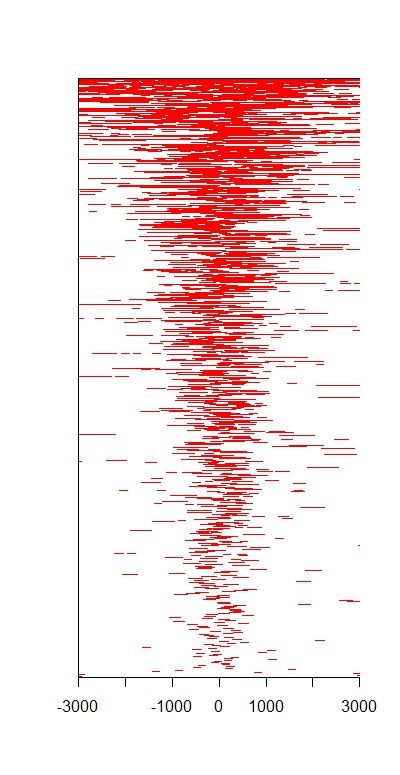
6.2.1 Heatmap of ChIP binding to TSS regions
tagHeatmap(tagMatrix, xlim=c(-3000, 3000), color="red")
备注,下面这个代码可以一步生成上面这个图
peakHeatmap(suz12, TxDb=txdb, upstream=3000, downstream=3000, color="blue")
>> preparing promoter regions...     2018-08-17 16:54:26
>> preparing tag matrix...       2018-08-17 16:54:26
>> generating figure...      2018-08-17 16:54:41
>> done...           2018-08-17 16:54:4
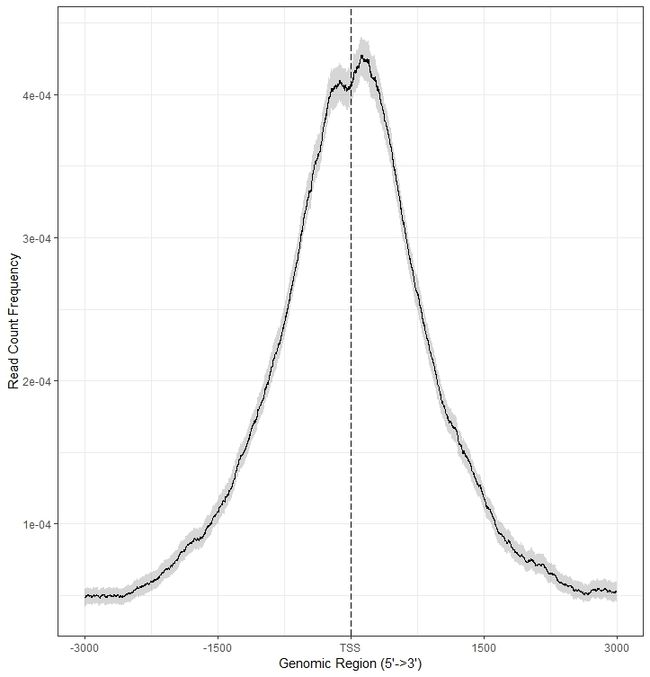
6.2.2 Average Profile of ChIP peaks binding to TSS region
plotAvgProf(tagMatrix, xlim=c(-3000, 3000),
            conf=0.95,resample = 1000,
            xlab="Genomic Region (5'->3')", ylab = "Read Count Frequency")
6.3 peaks注释
-
annotatePeak函数进行peaks注释,可以定义TSS(转录起始位点)区域,默认情况下TSS定义为-3kb到+ 3kb。 - annotatePeak的输出是csAnno格式。 ChIPseeker中国的
as.GRanges函数将csAnno转换为GRanges格式,as.data.frame将csAnno转换为data.frame,然后通过write.table将其导出到文件。 - TxDb.Hsapiens.UCSC.hg38.knownGene和TxDb.Hsapiens.UCSC.hg19.knownGene分别对应人类基因组hg38和hg19,TxDb.Mmusculus。
- UCSC.mm10.knownGene和TxDb.Mmusculus.UCSC.mm9.knownGene则对应小鼠基因组mm10和mm9。
- 用户还可以通过R
makeTxDbFromBiomart和makeTxDbFromUCSC从UCSC Genome Bioinformatics和BioMart数据库检索准备自己的TxDb对象。然后进行峰值注释。 - 所有的峰值信息都会保存在输出文件中。其中包含peak最近的gene的位置和链的信息,从peak到最近的gene的TSS的距离等。鉴于某些信息可能的重叠,ChIPseeker采取以下优先级别
Promoter
5’ UTR
3’ UTR
Exon
Intron
Downstream
Intergenic
更加具体信息参考作者用户手册。
peakAnno <- annotatePeak(suz12, tssRegion=c(-3000, 3000),
                         TxDb=txdb, annoDb="org.Mm.eg.db")
>> preparing features information...         2018-08-17 17:24:41
>> identifying nearest features...       2018-08-17 17:24:41
>> calculating distance from peak to TSS...  2018-08-17 17:24:42
>> assigning genomic annotation...       2018-08-17 17:24:42
>> adding gene annotation...             2018-08-17 17:24:51
'select()' returned 1:many mapping between keys and columns
>> assigning chromosome lengths          2018-08-17 17:24:52
>> done...                   2018-08-17 17:24:52
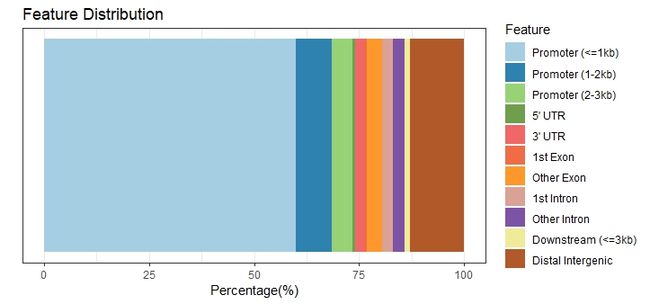
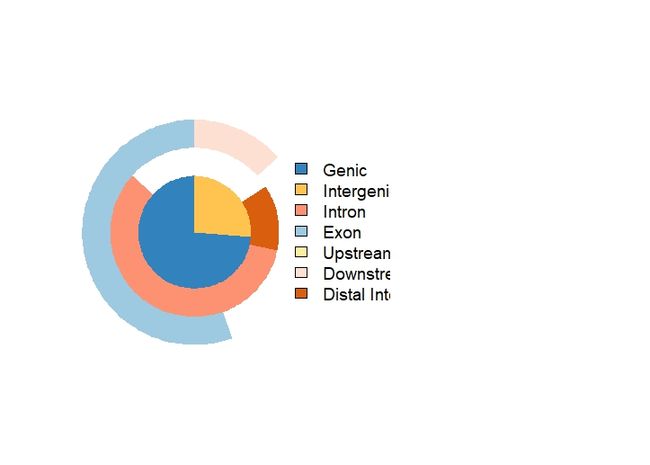
6.3.1 可视化基因组注释
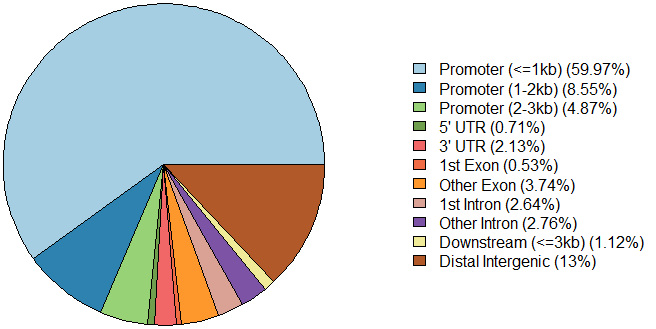
为了注释给定peak在基因组的位置特征信息,可使用annotatePeak函数,这些信息在输出信息的“annotation”列,包括peak是否在TSS,外显子,5'UTR,3'UTR,内含子或间隔区。很多研究人员对这些注释非常感兴趣。用户可以自己定义TSS区域。
有以下几种可视化方式
-
A:pie plot
plotAnnoPie(peakAnno)
----------------------------------------------------------------
-
B: bar plot
plotAnnoBar(peakAnno)
--------------------------------------------------------------
-
C: venn plot(重叠)
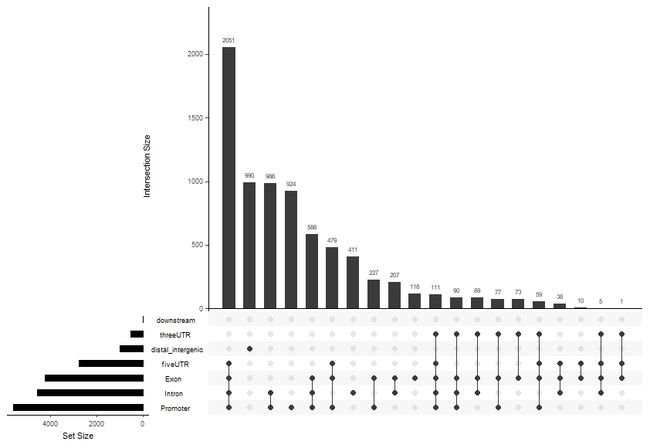
因为一些注释会重叠,如果想查看重叠的全部注释信息,可以使用veenpie函数
vennpie(peakAnno)
-----------------------------------------------------------
-
D: upsetplot(重叠)
upsetplot(peakAnno)
-------------------------------------------------------
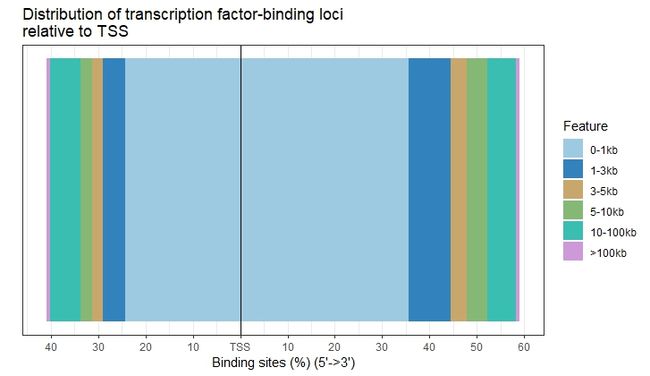
6.3.2 Visualize distribution of TF-binding loci relative to TSS
peak(TF结合位点)到最近的gene的TSS之间的距离可以有annotatePeak函数进行计算。作者提供了plotDistToTSS函数计算最近基因的TSS上游和下游的结合位点的百分比,并可视化这种分布。
plotDistToTSS(peakAnno,
              title="Distribution of transcription factor-binding loci\nrelative to TSS")
6.4 Functional enrichment analysis功能富集分析
因个人工作原因,最近没有更新,现在已经度过转变期,马上开始更新,感谢关注的朋友及发来私信的朋友。
我的博客即将搬运同步至腾讯云+社区,邀请大家一同入驻:https://cloud.tencent.com/developer/support-plan?invite_code=2ys0k0l1st2ck
