Xdebug deepens debugging PHP apps and websites to a level you can’t receive from the manual process of using code level var_dump().
Setup
To install Xdebug for PHP7 on Ubuntu you will need to do so manually. Ubuntu 15 and lower will not come with a package for PHP7 or its xDebug counterpart.
First, be sure you are using PHP 7 already by checking your version.
vagrant@homestead:~/www/caijing/cms_caijing$ php -v
Should give you something like:
PHP 7.0.1-1+deb.sury.org~trusty+2 (cli) ( NTS )
Copyright (c) 1997-2015 The PHP Group
Zend Engine v3.0.0, Copyright (c) 1998-2015 Zend Technologies
    with Xdebug v2.5.0, Copyright (c) 2002-2016, by Derick Rethans
    with Zend OPcache v7.0.6-dev, Copyright (c) 1999-2015, by Zend Technologies
In my case I’m using the Larval Homestead PHP 7 branch with Vagrant and the VirtualBox provider. So, I have PHP 7 already installed and working with Nginx.
Get your php.ini
Next output your php.ini information into a file or place you can get to the information from. I like to save mine to a file called php-info.txt.
vagrant@homestead:~/www/caijing/cms_caijing$ sudo php -i > ~/php-info.txt(一个你可以打开该文件的地方即可)
Use the Xdebug Wizard
打开 php-info 文件,全选,复制,粘贴到 https://xdebug.org/wizard.php,然后点击 analyse,等待结果。
按照结果提示一步步来即可。
Send the text file information into the wizard at Xdebug Wizard. Then follow the instructions the wizard supplies.
Also, if you are using OSX you may need to run brew install autoconf.
下面是我本机(zzp)的 Instructions:
- Download xdebug-2.5.0.tgz (到想要保存的目录中执行,或者使用绝对路径
sudo wget -O ~/downloads/xdebug-2.5.0.tgz https://xdebug.org/files/xdebug-2.5.0.tgz) - Unpack the downloaded file with
tar -xvzf xdebug-2.5.0.tgz - Run:
cd xdebug-2.5.0 - Run:
phpize(See the FAQ if you don't have phpize.)
As part of its output it should show:
Configuring for:
Zend Module Api No:      20151012
Zend Extension Api No:   320151012
If it does not, you are using the wrong phpize. Please follow this FAQ entry and skip the next step.
- Run:
./configure - Run:
make - Run:
cp modules/xdebug.so /usr/lib/php/20151012 - Edit /etc/php/7.0/cli/php.ini and add the line
zend_extension = /usr/lib/php/20151012/xdebug.so
这里,最好不要改动 php 的主配置文件,在 phpinfo() 输出内容中找到 Additional .ini files parsed,这里是辅助配置文件。本机为:/etc/php/7.0/fpm/conf.d,软链自:/etc/php/mods-available/
在目录下新建一个文件 xdebug.ini, 添加需要的这行代码。然后还需要在/etc/php/7.0/fpm/conf.d下创建软链。 - 重启服务
sudo service php7.0-fpm restart
sudo service nginx restart
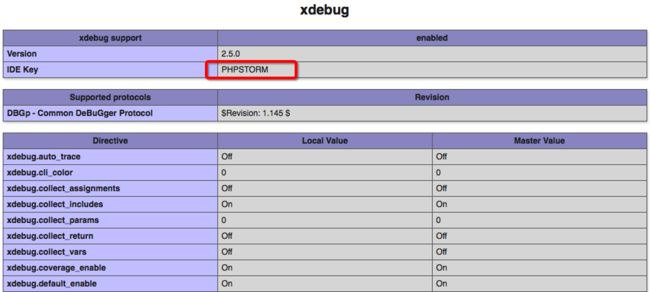
在项目的任何地方设置输出 phpinfo(), 在网页上能搜索到 xdebug 的内容,表示配置成功。
Enable Remote Xdebug
To use Xdebug remote debugging on a host computer you need to enable remote debugging on the guest server. In my case the guest is the Vagrant Homestead VM.
In the guest php.ini file add: (这些直接复制即可,不用改,同样添加至 xdebug.ini 即可)
xdebug.remote_enable = 1
xdebug.remote_connect_back=1
xdebug.remote_port = 9000
xdebug.scream=0
xdebug.show_local_vars=1
xdebug.idekey=PHPSTORM
Since I use PhpStorm for Debugging I set my Xdebug key to PHPSTORM.
In the browser, the Xdebug and PhpStorm will look for a cookie called XDEBUG_SESSION with the value PHPSTORM. To set this cookie I use the Chrome Browser extension Xdebug helper. (这里暂时没有用到)
Reboot Services
To load the new configurations reload your PHP and HTTP server services. In my case that is nginx and php7.0-fpm.
sudo service php7.0-fpm restart
sudo service nginx restart
Configure PHP Storm
Now that Xdebug is install we are ready to configure a “PHP Remote Debug” for PhpStorm.
Under
PhpStorm -> Preferences -> Languages&Frameworks -> PHP -> Debugbe sure Xdebug is set to port 9000-
Under
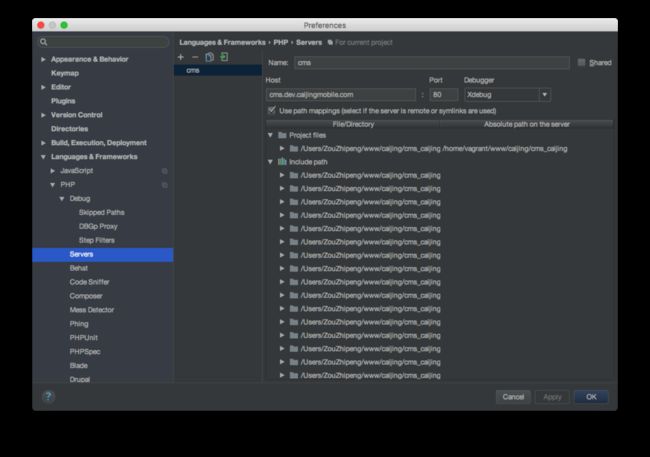
PhpStorm -> Preferences -> Languages&Frameworks -> PHP -> Servers, add a server using port 80 and set the Absolute path on the server.
其中,因为是虚拟机远程服务器的原因,勾选了使用 path mappings,将本地的项目目录/Users/ZouZhipeng/www/caijing/cms_caijing和服务器上的绝对路径/home/vagrant/www/caijing/cms_caijing进行关联。
-
屏幕上方的菜单栏:Under
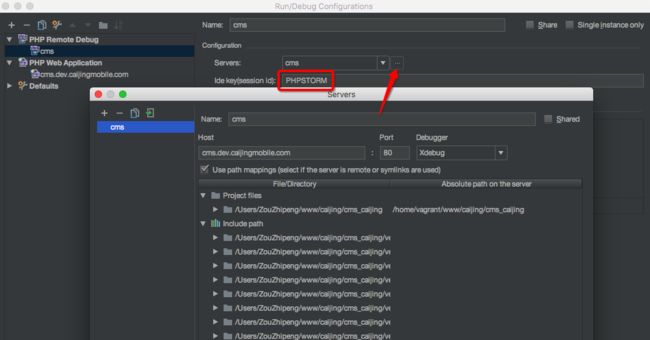
Run -> Edit Configurations添加一个 PHP Remote Debug, 选择 Servers 后点击省略号,即跳转到 Server 配置页面,即上面第二步操作的。
Set the server and the Ide key(session id) to PHPSTORM
-
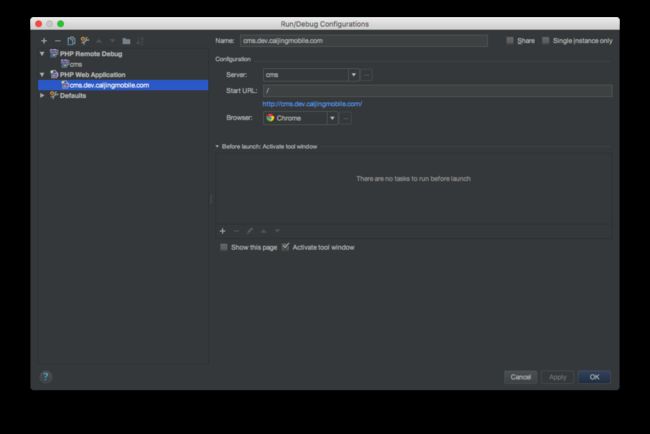
还是刚才的页面,左侧➕,添加一个 PHP Web Application,我的配置如下
start URL 为项目开始的地址,即下方蓝色 url,点击臭虫会直接跳转到这里。
Using PhpStorm with Xdebug on a Remote Server (这部分没用到)
To start receiving requests from the remote server enable “Debug” with Xdebug helper in Google Chrome on the page you want to debug. Then, unlike local testing that uses “Start Listening for PHP Debug Connections” use Run > Debug instead.
Using the “Debug” command will open up the signal manually and open the direct connection to the remote server.
Set breakpoints and you are off.
Out of Network Servers (troubleshooting,暂未用到)
If you are trying to remote debug a website with Xdebug from outside your local network be sure the 9000 port is not blocked on your network. This is typically done at the router level.
As always consult the Xdebug remote documentation.
Next, ask Google “what is my public ip” and it will tell you.
Then be sure your remote server is not blocking your IP address.
使用方法
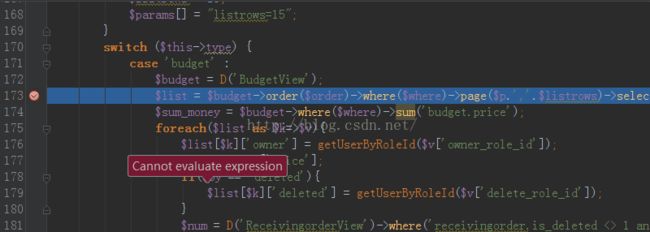
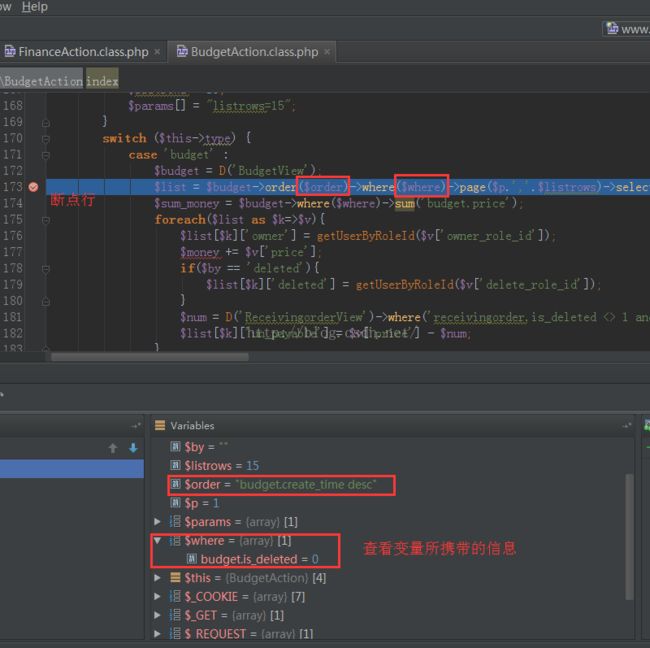
在需要调试的行上打上断点(点击一下行号后面的空白处即可,再点一次取消断点),需要说明的是当程序运行到该断点时,程序会停留在该行,但该行本身不会执行。自此可以查看程序运行到此处时所包含的所有数据信息。当然,查看信息功能相当于使用echo,print或者var_dump。
操作流程
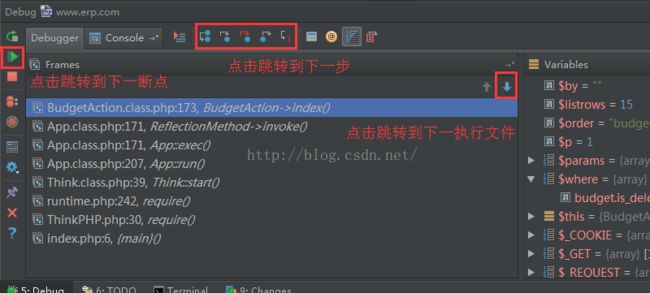
打断点—>点击臭虫—>点击浏览器页面触发断点—>自动跳转回PhpStorm—>查看携带的数据(调试的目的)—>可按步执行查找问题点—>点击运行(或者F5)—>浏览器页面继续执行—>调试完成
参考:
http://blog.csdn.net/knight_quan/article/details/51953269
https://xdebug.org/wizard.php
https://php-built.com/2016/01/20/installing-xdebug-for-php7/

