一、主题式网络爬虫设计方案(15分)
1.主题式网络爬虫名称
基于智联招聘全国python岗位数据爬虫
2.主题式网络爬虫爬取的内容与数据特征分析
2.1爬取的内容
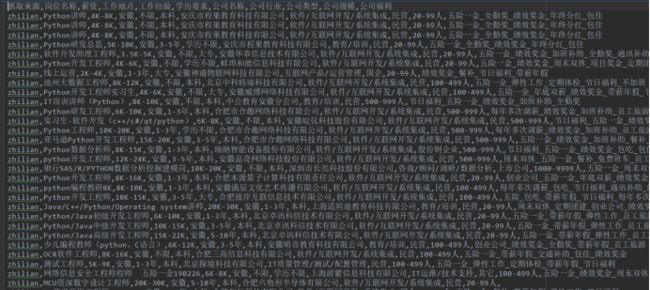
抓取来源,岗位名称,薪资,地址,工作经验,学历要求,公司名称,公司行业,公司类型,公司规模,公司福利
2.2数据特征分析
分析python岗位地区热度,公司共有福利,薪资比例,学历要求比例
3.主题式网络爬虫设计方案概述(包括实现思路与技术难点)
实现思路:
1、通过网页请求查看网页格式以及请求过程
2、使用requests库爬取数据
3、通过xpath语法获取所要的相关数据
4、使用pyecharts1.2版本进行可视化
技术难点:
城市信息隐藏在网页中,需要仔细查看才知道,并使用正则匹配出来。页面数据需要去找对应请求的接口
二、主题页面的结构特征分析(15分)
1、主题页面的结构特征
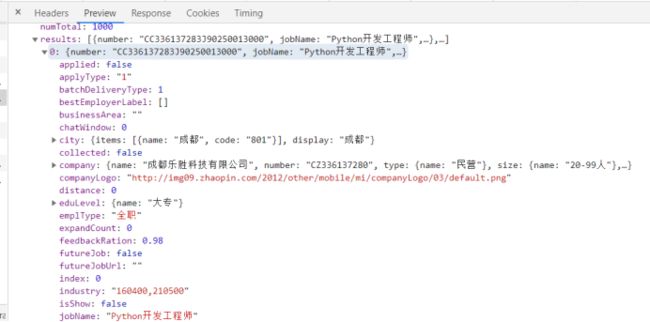
通过浏览器的F12键打开窗口,然后切换到NetWork下,选择第一个,然后点response,找到城市数据,页面岗位信息并没有在html中查看到,发现是通过异步加载的,通过xhr筛选查看到请求接口
2、HTML页面解析
1. 城市信息隐藏在网页中
![]()
然后每个城市下的页数不定,需要动态判断页数然后抓取
数据全是异步加载,可以通过network下筛选XHR方式查看到
3、 节点(标签)查找方法与遍历发法(必要时画出节点数结构)
通过正则匹配出城市信息,然后通过正则解析遍历每个城市,然后通过请求json数据,解析每个岗位的信息,而页数,则是通过返回json中的numTotal 来判定,因为每页数据量是90条,而页数就是条数除以90,如果有余数就加1页
三、网络爬虫程序设计(60分)
爬虫程序主体要包括以下各部分,要附源代码及较详细注释,并在每部分程序后面提供输出结果的截图。
1、数据爬取与采集
爬取网页中城市信息
 1 # 构建待抓取url列表
 2 def get_province():
 3     # 随意访问一个网址
 4     start_url = 'https://sou.zhaopin.com/?p=12&jl=489&sf=0&st=0&kw=%E8%BD%AF%E4%BB%B6&kt=3'
 5     # 发起请求
 6     rsp = requests.get(url=start_url, headers=headers)
 7     # 正则匹配城市信息
 8     city_str = re.search('__INITIAL_STATE__=(.*?)', rsp.text, re.S).group(1)
 9     # 解析成json格式
10     city_json = json.loads(city_str)
11     province = city_json['basic']['dict']['location']['province']
12     return province
循环遍历城市,抓取每个城市下的信息
1 # 存放抓取结果
2 page_data = []
3 for item in province:
4     for sub in item['sublist']:
5         # 启动爬虫
6         result = start_zl(item['name'], sub['code'], keyword)
7         if len(result) != 0:
8             page_data.extend(result)
每个城市下的抓取代码,以及获取页数翻页
 1 def start_zl(city_name, city_code, keyword):
 2     print("抓取城市:" + city_name + "_" + city_code + "信息中")
 3     page = 0
 4     max = None
 5     result = []
 6     while True:
 7         print('当前{}页中'.format(page + 1))
 8         next_page = page * 90
 9         now_time = int(time.time() * 1000)
10         url = "https://fe-api.zhaopin.com/c/i/sou?" \
11               "pageSize=90" \
12               "&cityId={}" \
13               "&salary=0,0&workExperience=-1&education=-1&companyType=-1&employmentType=-1&jobWelfareTag=-1&" \
14               "kw={}" \
15               "&start={}" \
16               "&kt=3&_v={}" \
17               "&x-zp-page-request-id=84cec3861cb34e77a0f76870970d07c1-{}-988542" \
18               "&x-zp-client-id=cd61dab4-7d6d-4c58-a963-b9a4c1474d9f".format(city_code, keyword, next_page,
19                                                                             random.random(), now_time)
20         while True:
21             try:
22                 rsp = requests.get(url=url, headers=headers)
23                 desc_json = json.loads(rsp.text)
24                 if desc_json['data']['numTotal'] == 0:
25                     max = 0
26                     break
27                 # 获取页数
28                 if max is None:
29                     count = desc_json['data']['numTotal']
30                     if count <= 90:
31                         max = 1
32                     else:
33                         if count % 90 == 0:
34                             max = count // 90
35                         else:
36                             max = count // 90 + 1
37                 for item in desc_json['data']['results']:
38                     try:
39                         result.append(
40                             ['zhilian', item['jobName'], item['salary'], city_name, item['workingExp']['name'], item['eduLevel']['name'], item['company']['name'],
41                              item['jobType']['items'][0]['name'], item['company']['type']['name'],
42                              item['company']['size']['name'], '_'.join(item['welfare'])])
43                     except Exception as e:
44                         continue
45                 break
46             except Exception as e:
47                 print(url)
48                 print("错误:", e, ", 返回结果:", rsp.text)
49         if page >= max:
50             break
51         page += 1
52
53     return result
2、对数据进行清洗和处理
通过pandas读取csv文件
1 # 读取excel文件
2 df = pd.read_csv('最终数据.csv', encoding='utf-8')
对学历信息进行处理,合并中专、中技到中专/中技,将不明数据合并到其他中
 1 # 格式化学历信息
 2 education = []
 3 for c in df['学历要求']:
 4     if '月' in c:
 5         c = '其他'
 6     elif c == '中专' or c == '中技':
 7         c = '中专/中技'
 8     education.append(c)
 9 df['education'] = education
10 # 按楼层分组
11 df_education = df.groupby(df['education'])
12 df_education = df_education.size()
13 value = df_education.values
14 attr = list(df_education.keys())
对薪资数据进行处理,首先去掉面议等数据,然后针对薪资,抓取格式是2-10k这种,我们正则匹配出数字,两位的就取两位数字和,然后除2,即中位值
 1 pattern = '\d+'
 2 # 去除 "薪资面议" 等无效数据
 3 df.drop(df[df['薪资'].str.contains('面议')].index, inplace=True)
 4
 5 salary_list = df['薪资'].values
 6 # 将字符串转化为列表
 7 df['salary'] = df['薪资'].str.findall(pattern)
 8 avg_salary = []
 9 # 统计平均工资
10 for salary in salary_list:
11     k = re.findall(pattern, salary)
12     int_list = [int(n) for n in k]
13     # 取工资区间平均值
14     if len(int_list) == 2:
15         avg_wage = (int_list[1] + int_list[0]) / 2
16     else:
17         avg_wage = int_list[0]
18     # 去除无效数据
19     if 0 < avg_wage < 100:
20         avg_salary.append(avg_wage * 1000)
3、文本分析
针对公司福利采用了jieba分词,并进行词云图展示
 1 # 公司福利词云图
 2 def word_cloud():
 3     wc = WordCloud({"theme": ThemeType.MACARONS})
 4     word_dict = {}
 5     for word in df['公司福利']:
 6         if 'nan' in str(word):
 7             continue
 8         r = r"[0-9\s+\.\!\/_,$%^*()?;;:-【】+\"\']+|[+——!,;:。?、~@#¥%……&*()]+"
 9         # 去除特殊符号
10         word = re.sub(r, '', str(word), re.S)
11         # cut分词,并去重
12         words = set(jieba.cut(word, cut_all=False))
13         # 统计词频
14         for word in words:
15             if len(word) < 2:
16                 continue
17             if word not in word_dict:
18                 word_dict[word] = 1
19             else:
20                 word_dict[word] += 1
21     # 词频排序
22     word_list = sorted(word_dict.items(), key=lambda x: x[1], reverse=True)
23     # 生成图
24     wc.add("", word_list, word_size_range=[20, 100], shape=SymbolType.DIAMOND)
25     wc.set_global_opts(title_opts=opts.TitleOpts(title="福利分析"))
26     return wc
4、可视化处理
学历岗位占比图
 1 left_num = 10
 2 rigth_num = 30
 3 for x in range(0, len(value)):
 4     pie.add(
 5         "",
 6         [[attr[x], round(value[x] / val_sum * 100, 2)], ["剩余", round((val_sum - value[x]) / val_sum * 100, 2)]],
 7         center=[str(left_num) + '%', str(rigth_num) + '%'],
 8         radius=[60, 80],
 9         label_opts=new_label_opts()
10     )
11     left_num += 20
12     if left_num > 90:
13         left_num = 10
14         rigth_num += 40
15 pie.set_global_opts(
16     title_opts=opts.TitleOpts(title="学历岗位数对比"),
17     legend_opts=opts.LegendOpts(
18         type_="scroll", pos_top="5%"
19     ),
20 )
城市地图岗位对应图
 1 map = Map({"theme": ThemeType.MACARONS})
 2 map.add(
 3     "岗位数",
 4     [list(z) for z in zip(attr, value)],
 5     "china"
 6 )
 7 map.set_global_opts(
 8     title_opts=opts.TitleOpts(title="地区岗位数对比"),
 9     visualmap_opts=opts.VisualMapOpts(max_=200),
10 )
工资区间柱状图
1 label = [
2     '3k以下', '3k-5k', '5k-8k', '8k-12k', '12k-15k', '15k-20k', '20k-25k', '25k以上'
3 ]
4 bar = Bar()
5 bar.add_xaxis(label)
6 bar.add_yaxis('智联', pin_value)
7
8 bar.set_global_opts(title_opts=opts.TitleOpts(title="平台岗位工资对比"))
5、数据持久化
采用csv方式储存
1 with open("智联全国数据.csv", "w", newline='', encoding='utf-8') as datacsv:
2     # dialect为打开csv文件的方式,默认是excel,delimiter="\t"参数指写入的时候的分隔符
3     csvwriter = csv.writer(datacsv, dialect=("excel"))
4     # csv文件插入一行数据
5     csvwriter.writerow(['抓取来源', '岗位名称', '薪资', '工作地点', '工作经验', '学历要求', '公司名称', '公司行业', '公司类型', '公司规模', '公司福利'])
6     for temp in page_data:
7         # csv文件插入一行数据
8         csvwriter.writerow(temp)
6、最终代码
  1 import requests
  2 import time
  3 import json
  4 import csv
  5 import re
  6 import random
  7 import openpyxl
  8
  9
 10 def start_zl(city_name, city_code, keyword):
 11     print("抓取城市:" + city_name + "_" + city_code + "信息中")
 12     page = 0
 13     max = None
 14     result = []
 15     while True:
 16         print('当前{}页中'.format(page + 1))
 17         next_page = page * 90
 18         now_time = int(time.time() * 1000)
 19         url = "https://fe-api.zhaopin.com/c/i/sou?" \
 20               "pageSize=90" \
 21               "&cityId={}" \
 22               "&salary=0,0&workExperience=-1&education=-1&companyType=-1&employmentType=-1&jobWelfareTag=-1&" \
 23               "kw={}" \
 24               "&start={}" \
 25               "&kt=3&_v={}" \
 26               "&x-zp-page-request-id=84cec3861cb34e77a0f76870970d07c1-{}-988542" \
 27               "&x-zp-client-id=cd61dab4-7d6d-4c58-a963-b9a4c1474d9f".format(city_code, keyword, next_page,
 28                                                                             random.random(), now_time)
 29         while True:
 30             try:
 31                 rsp = requests.get(url=url, headers=headers)
 32                 desc_json = json.loads(rsp.text)
 33                 if desc_json['data']['numTotal'] == 0:
 34                     max = 0
 35                     break
 36                 # 获取页数
 37                 if max is None:
 38                     count = desc_json['data']['numTotal']
 39                     if count <= 90:
 40                         max = 1
 41                     else:
 42                         if count % 90 == 0:
 43                             max = count // 90
 44                         else:
 45                             max = count // 90 + 1
 46                 for item in desc_json['data']['results']:
 47                     try:
 48                         result.append(
 49                             ['zhilian', item['jobName'], item['salary'], city_name,
 50                              item['workingExp']['name'], item['eduLevel']['name'], item['company']['name'],
 51                              item['jobType']['items'][0]['name'], item['company']['type']['name'],
 52                              item['company']['size']['name'], '_'.join(item['welfare'])])
 53                     except Exception as e:
 54                         continue
 55                 break
 56             except Exception as e:
 57                 print(url)
 58                 print("错误:", e, ", 返回结果:", rsp.text)
 59         if page >= max:
 60             break
 61         page += 1
 62
 63     return result
 64
 65
 66 # 构建待抓取url列表
 67 def get_province():
 68     # 随意访问一个网址
 69     start_url = 'https://sou.zhaopin.com/?p=12&jl=489&sf=0&st=0&kw=%E8%BD%AF%E4%BB%B6&kt=3'
 70     # 发起请求
 71     rsp = requests.get(url=start_url, headers=headers)
 72     # 正则匹配城市信息
 73     city_str = re.search('__INITIAL_STATE__=(.*?)', rsp.text, re.S).group(1)
 74     # 解析成json格式
 75     city_json = json.loads(city_str)
 76     province = city_json['basic']['dict']['location']['province']
 77     return province
 78
 79
 80 if __name__ == "__main__":
 81     headers = {
 82         "User-Agent": 'Mozilla/5.0 (Windows NT 6.1; Win64; x64) AppleWebKit/537.36 (KHTML, like Gecko) Chrome/74.0.3729.169 Safari/537.36'
 83     }
 84     # 获取城市信息
 85     province = get_province()
 86     print(province)
 87     # 搜索关键词
 88     keyword = 'python'
 89
 90     # 存放抓取结果
 91     page_data = []
 92     for item in province:
 93         for sub in item['sublist']:
 94             # 启动爬虫
 95             result = start_zl(item['name'], sub['code'], keyword)
 96             if len(result) != 0:
 97                 page_data.extend(result)
 98
 99     with open("智联全国数据.csv", "w", newline='', encoding='utf-8') as datacsv:
100         # dialect为打开csv文件的方式,默认是excel
101         csvwriter = csv.writer(datacsv, dialect=("excel"))
102         # csv文件插入一行数据
103         csvwriter.writerow(['抓取来源', '岗位名称', '薪资', '工作地点', '工作经验', '学历要求', '公司名称', '公司行业', '公司类型', '公司规模', '公司福利'])
104         for temp in page_data:
105             # csv文件插入一行数据
106             csvwriter.writerow(temp)
107
108     print("抓取完成")
  1 from pyecharts.charts import Page, Bar, Map, WordCloud, Pie, Line
  2 from pyecharts import options as opts
  3 import pandas as pd
  4 from pyecharts.commons.utils import JsCode
  5 from pyecharts.globals import ThemeType, SymbolType
  6 import re
  7 import jieba
  8
  9
 10 # 学历分布饼图
 11 def pie_multiple():
 12     # 格式化学历信息
 13     education = []
 14     for c in df['学历要求']:
 15         if '月' in c:
 16             c = '其他'
 17         elif c == '中专' or c == '中技':
 18             c = '中专/中技'
 19         education.append(c)
 20     df['education'] = education
 21     # 按楼层分组
 22     df_education = df.groupby(df['education'])
 23     df_education = df_education.size()
 24
 25     value = df_education.values
 26     attr = list(df_education.keys())
 27     print(attr)
 28     val_sum = sum(value)
 29     pie = Pie({"theme": ThemeType.MACARONS})
 30     # 格式化显示格式
 31     fn = """
 32         function(params) {
 33             if(params.name == '剩余')
 34                 return '\\n\\n\\n' + params.name + ' : ' + params.value + '%';
 35             return params.name + ' : ' + params.value + '%';
 36         }
 37         """
 38
 39     def new_label_opts():
 40         return opts.LabelOpts(formatter=JsCode(fn), position="center")
 41
 42     left_num = 10
 43     rigth_num = 30
 44     for x in range(0, len(value)):
 45         pie.add(
 46             "",
 47             [[attr[x], round(value[x] / val_sum * 100, 2)], ["剩余", round((val_sum - value[x]) / val_sum * 100, 2)]],
 48             center=[str(left_num) + '%', str(rigth_num) + '%'],
 49             radius=[60, 80],
 50             label_opts=new_label_opts()
 51         )
 52         left_num += 20
 53         if left_num > 90:
 54             left_num = 10
 55             rigth_num += 40
 56     pie.set_global_opts(
 57         title_opts=opts.TitleOpts(title="学历岗位数对比"),
 58         legend_opts=opts.LegendOpts(
 59             type_="scroll", pos_top="5%"
 60         ),
 61     )
 62     return pie
 63
 64
 65 # 岗位覆盖地区图
 66 def map_visualmap():
 67     # 格式化地区信息
 68     county = []
 69     for cou in df['工作地点']:
 70         cou = cou[:2]
 71         county.append(cou)
 72     df['county'] = county
 73     # 按楼层分组
 74     df_county = df.groupby(df['county'])
 75     # 获取分组后的数据
 76     county_size = df_county.size()
 77     value = county_size.values
 78     value = [int(val) for val in value]
 79     attr = list(county_size.keys())
 80
 81     map = Map({"theme": ThemeType.MACARONS})
 82     map.add(
 83         "岗位数",
 84         [list(z) for z in zip(attr, value)],
 85         "china"
 86     )
 87     map.set_global_opts(
 88         title_opts=opts.TitleOpts(title="地区岗位数对比"),
 89         visualmap_opts=opts.VisualMapOpts(max_=200),
 90     )
 91     return map
 92
 93
 94 # 工资区间柱状图
 95 def bar_img():
 96     fanwei = [0, 3000, 5000, 8000, 12000, 15000, 20000, 25000, 100000]
 97     label = [
 98         '3k以下', '3k-5k', '5k-8k', '8k-12k', '12k-15k', '15k-20k', '20k-25k', '25k以上'
 99     ]
100     bar = Bar()
101     bar.add_xaxis(label)
102
103     pattern = '\d+'
104     # 去除 "薪资面议" 等无效数据
105     df.drop(df[df['薪资'].str.contains('面议')].index, inplace=True)
106
107     salary_list = df['薪资'].values
108     # 将字符串转化为列表
109     df['salary'] = df['薪资'].str.findall(pattern)
110     avg_salary = []
111     # 统计平均工资
112     for salary in salary_list:
113         k = re.findall(pattern, salary)
114         int_list = [int(n) for n in k]
115         # 取工资区间平均值
116         if len(int_list) == 2:
117             avg_wage = (int_list[1] + int_list[0]) / 2
118         else:
119             avg_wage = int_list[0]
120         # 去除无效数据
121         if 0 < avg_wage < 100:
122             avg_salary.append(avg_wage * 1000)
123
124     df_avg = pd.DataFrame({'avg': avg_salary})
125     # 对工资进行分组 比如:0-3000, 3000-5000这种
126     fenzu = pd.cut(df_avg['avg'].values, fanwei, right=False)  # 分组区间
127     pin_shu = fenzu.value_counts()  # series,区间-个数
128     pin_value = pin_shu.values
129     pin_value = [int(pin) for pin in pin_value]
130
131     bar.add_yaxis('智联', pin_value)
132
133     bar.set_global_opts(title_opts=opts.TitleOpts(title="平台岗位工资对比"))
134     return bar
135
136
137 # 公司福利词云图
138 def word_cloud():
139     wc = WordCloud({"theme": ThemeType.MACARONS})
140     word_dict = {}
141     for word in df['公司福利']:
142         if 'nan' in str(word):
143             continue
144         r = r"[0-9\s+\.\!\/_,$%^*()?;;:-【】+\"\']+|[+——!,;:。?、~@#¥%……&*()]+"
145         # 去除特殊符号
146         word = re.sub(r, '', str(word), re.S)
147         # cut分词,并去重
148         words = set(jieba.cut(word, cut_all=False))
149         # 统计词频
150         for word in words:
151             if len(word) < 2:
152                 continue
153             if word not in word_dict:
154                 word_dict[word] = 1
155             else:
156                 word_dict[word] += 1
157     # 词频排序
158     word_list = sorted(word_dict.items(), key=lambda x: x[1], reverse=True)
159     # 生成图
160     wc.add("", word_list, word_size_range=[20, 100], shape=SymbolType.DIAMOND)
161     wc.set_global_opts(title_opts=opts.TitleOpts(title="福利分析"))
162     return wc
163
164
165 if __name__ == "__main__":
166     # 读取excel文件
167     df = pd.read_csv('智联全国数据.csv', encoding='utf-8')
168
169     # 自定义画布,多图合一
170     page = Page(layout=Page.SimplePageLayout)
171
172     # 添加到页面
173     page.add(pie_multiple(), map_visualmap(), bar_img(), word_cloud())
174     # page.add()
175
176     page.render('智联可视化.html')
四、结论(10分)
1、经过对主题数据的分析与可视化,可以得到哪些结论?
1、python岗位,果然还是大城市就业好,北上广相对其他地区,明显好就业些
2、虽然说研究生以上文凭要好很多,但是针对学历这块,本科文凭还是很吃香,主要集中是在这一块
3、通过工资图发现,一般python岗位的工资集中在5k-20k间,其中8k-12k的岗位数最多
4、而公司福利方面,基本每家公司都有五险一金这些基本福利,还是不错的
2、对本次程序设计任务完成的情况做一个简单的小结
通过这次的爬虫作业,正好也想看下关于python的就业情况,也算有了个了解,针对代码方面,还是有很多没明白的,但是也学习到了很多知识,以后会继续加油。


