I must have read 8 – 10 articles scattered about the internet when I first got PhpStorm setup to do debugging with Xdebug and MAMP. Each article seems to be missing one key piece of the puzzle. After a few days mucking with everything, I was able to get the stars to align. And it’s one of those things that, once you get it working, it just works and you don’t have to bother with it again.
However, that initial setup can be very frustrating. And since my good friend,Tom McFarlin,decided to give PhpStorm another serious look, I thought I’d document how I was able to get things setup and hopefully save him and you some time.
What I am about outline below is working with MAMP PRO 3 and PhpStorm 8, though I have had the same success with MAMP PRO 2 and PhpStorm 7. I also assume that most of this is applicable to the regular, non-pro version of MAMP, though I have not tested it.
Xdebug
Fortunately, Xdebug is already included with MAMP, so there is nothing we need to install in addition to MAMP itself. We simple need to enable it within MAMP.
MAMP
You should just be able to enable Xdebug within MAMP by checking the Activate Xdebug option under the PHP tab. And that should be it, at least for MAMP 3.
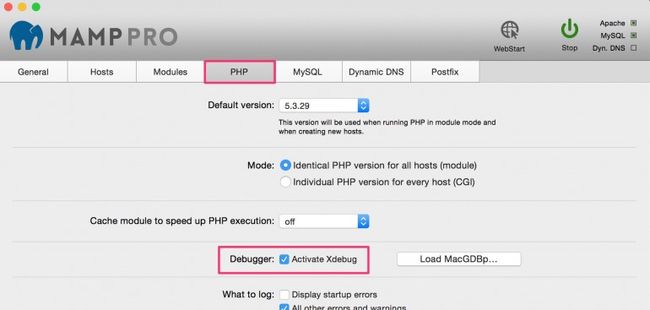
For most of you reading this, you can just stop here and move onto the PhpStorm section.
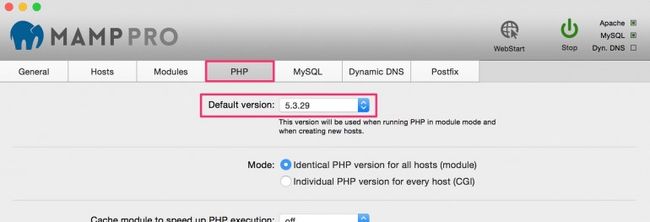
However, if you are using MAMP 2, or if you want to ensure that MAMP 3 is indeed configured correctly, you’ll first need to identify what version of PHP you’re using with MAMP. Simply navigate to the PHP tab in MAMP and take note of what you’re default PHP version is.
Or, if you’re running a more advanced setup in MAMP PRO, with different PHP versions for different hosts, head to your Hosts tab to see what PHP version you’re running for the particular host you’re wanting to debug.

With the PHP version identified, you’ll want to open and edit the corresponding php.ini file to enable Xdebug by navigating toFile > Edit Template > PHP > PHP [VERSION] php.ini.
With thephp.inifile open, you’ll want to find the[xdebug]section, which is usually at the very bottom of the file.
At the very minimum, you’ll want to have the following entered and uncommented.
xdebug.remote_autostart=1
xdebug.remote_enable=1
xdebug.remote_host=localhost
xdebug.remote_port=9000
MAMP 2 used to require a bit more configuration, specifically the definition of a zend_extension, so you might want to add all of the following of the minimum configuration does not work for you. Or if you’re using MAMP 3 and you want to enable things like coverage and profiling capabilities.
Please note that the zend_extensions path to thexdebug.sofile will vary depending on the PHP version you’re using, so make sure you look up the correct path on your filesystem.
zend_extension="/Applications/MAMP/bin/php/php5.3.29/lib/php/extensions/no-debug-non-zts-20090626/xdebug.so"
xdebug.coverage_enable=1
xdebug.default_enable=1
xdebug.profiler_enable=1
xdebug.profiler_output_dir="/tmp"
xdebug.remote_autostart=1
xdebug.remote_enable=1
xdebug.remote_host=localhost
xdebug.remote_port=9000
PhpStorm
With PhpStorm open, navigate toRun > Edit Configurations....
Now, if I were to type out everything you’d need to do, it’d be very lengthy. Instead, I created a short GIF to demonstrate what needs to happen. In short, we need to point PhpStorm to the server we want to debug.
You’ll use whatever host and port you’ve configured within MAMP. For this example, I’ve created the hostiowagirleats.devin MAMP PRO (which is also shown in the screenshots above) and I customized my MAMP Apache port to run on port80. If you’re running just MAMP (the non-pro version) or if you didn’t create a custom host, or if you didn’t customize the ports within MAMP, then you’d probably be usinglocalhostwith a port of8888for the configuration below.

Once this is complete, you should see the Debug configuration you just created in the upper right part of PhpStorm.

Seeing Is Believing!
And that should be it!
Set a breakpoint in PhpStorm by clicking in the margin of an open PHP file, click the “bug” next to the configuration you just created to start debugging, and you should hit your breakpoint and feel like you finally have visibility into a once dark and secret world. Gone are the days of the antiquatedvar_dumpas you fumble around to discover what is going on!

Hopefully that helped connect all the dots for you and you’re also up and running.
Please let me know in the comments below if you hit any snags and I’ll try my best to help out.