[TOC]
protometheus
Prometheus 是由 SoundCloud 开源监控告警解决方案。
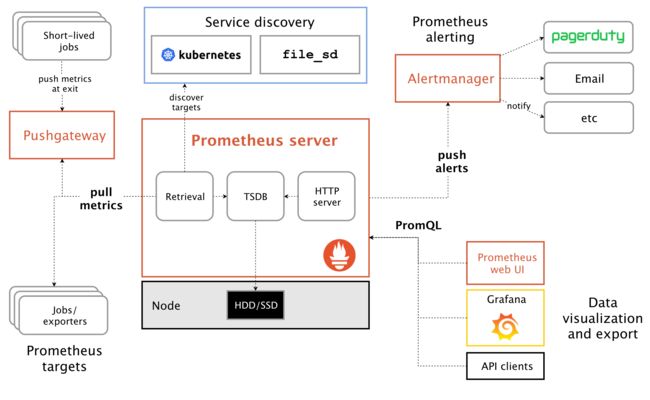
prometheus
prometheus存储的是时序数据,即按相同时序(相同名称和标签),以时间维度存储连续的数据的集合。
时序(time series)是由名字(Metric)以及一组key/value标签定义的,具有相同的名字以及标签属于相同时序。
metric名字:表示metric的功能,如
http_request_total。时序的名字由 ASCII 字符,数字,下划线,以及冒号组成,它必须满足正则表达式 [a-zA-Z_:][a-zA-Z0-9_:]*, 其名字应该具有语义化,一般表示一个可以度量的指标,例如 http_requests_total, 可以表示 http 请求的总数。标签:
-
样本:按照某个时序以时间维度采集的数据,称之为样本。实际的时间序列,每个序列包括一个float64的值和一个毫秒级的时间戳
一个 float64 值
一个毫秒级的 unix 时间戳
格式:Prometheus时序格式与
OpenTSDB相似:
{ Metric类型:
Counter: 一种累加的metric,如请求的个数,结束的任务数,出现的错误数等Gauge: 常规的metric,如温度,可任意加减。其为瞬时的,与时间没有关系的,可以任意变化的数据。Histogram: 柱状图,用于观察结果采样,分组及统计,如:请求持续时间,响应大小。其主要用于表示一段时间内对数据的采样,并能够对其指定区间及总数进行统计。根据统计区间计算Summary: 类似Histogram,用于表示一段时间内数据采样结果,其直接存储quantile数据,而不是根据统计区间计算出来的。不需要计算,直接存储结果
PromQL
PromQL (Prometheus Query Language) 是 Prometheus 自己开发的数据查询 DSL 语言。
查询结果类型:
瞬时数据 (Instant vector): 包含一组时序,每个时序只有一个点,例如:
http_requests_total区间数据 (Range vector): 包含一组时序,每个时序有多个点,例如:
http_requests_total[5m]纯量数据 (Scalar): 纯量只有一个数字,没有时序,例如:
count(http_requests_total)
查询条件:通过名称及标签进行查询,如http_requests_total等价于{name="http_requests_total"}
查询level="info"的event: logback_events_total{level="info"}
查询条件支持正则匹配:
http_requests_total{code!="200"} // 表示查询 code 不为 "200" 的数据

http_requests_total{code=~"2.."} // 表示查询 code 为 "2xx" 的数据

http_requests_total{code!~"2.."} // 表示查询 code 不为 "2xx" 的数据
内置函数:
- 如将浮点数转换为整数:
floor(avg(http_requests_total{code="200"}))

ceil(avg(http_requests_total{code="200"}))
- 查看每秒数据 :
rate(http_requests_total[5m])
基本查询:
1.查询当前所有数据
logback_events_total
2.模糊查询: level="inxx"
logback_events_total{level=~"in.."}

logback_events_total{level=~"in.*"}
3.比较查询: value>0
logback_events_total > 0
4.范围查询: 过去5分钟数据
logback_events_total[5m]
时间范围单位有以下:
s: 秒m: 分钟h: 小时d: 天w: 周y: 年
在瞬时向量表达式或者区间向量表达式中,都是以当前时间为基准。
如果想查询5分钏前的瞬时样本数据,则需要使用位移操作,关键字:offset, 其要紧跟在选择器{}后面。如:
sum(http_requests_total{method="GET"} offset 5m)

rate(http_requests_total[5m] offset 1w)
聚合、统计高级查询:
1. count查询: count(logback_events_total)
2. sum查询: sum(logback_events_total)
3. svg查询:
4. topk: 如查询2的值:topk(2, logback_events_total)
5. irate: 如查询过去5分钟的平均值: irate( logback_events_total[5m])
配置
启动时,可以加载运行参数-config.file指定配置文件, 默认为prometheus.yml:
在该配置文件中可以指定各种属性,其结构体定义如下:
type Config struct {

    GlobalConfig GlobalConfig `yaml:"global"`

    AlertingConfig AlertingConfig `yaml:"alerting,omitempty"`

    RuleFiles []string `yaml:"rule_files,omitempty"`

    ScrapeConfigs []*ScrapeConfig `yaml:"scrape_configs,omitempty"`

    RemoteWriteConfigs []*RemoteWriteConfig `yaml:"remote_write,omitempty"`

    RemoteReadConfigs []*RemoteReadConfig `yaml:"remote_read,omitempty"`

    // Catches all undefined fields and must be empty after parsing.

    XXX map[string]interface{} `yaml:",inline"`

    // original is the input from which the config was parsed.

    original string

}
全局配置
global: 主要有四个属性
scrape_interval: 拉取 targets 的默认时间间隔。scrape_timeout: 拉取一个 target 的超时时间。evaluation_interval: 执行 rules 的时间间隔。external_labels: 额外的属性,会添加到拉取的数据并存到数据库中。
Exporter
负责数据汇报的程序统一叫Exporter,不同的Exporter负责不同的业务。其统一命名格式:xx_exporter
已有exporter
clientlib
pull模式
prometheus.yml内容如下:
global:

  scrape_interval: 15s

  evaluation_interval: 15s

rule_files:

  # - "first.rules"

  # - "second.rules"

scrape_configs:

  - job_name: 'spring'

    metrics_path: '/actuator/prometheus'

    static_configs:

      - targets: ['自己本机ip:8080']
启动prometheus docker:
docker run --name prom --hostname prom -p 9090:9090 -v /Users/liukun/config/prometheus.yml:/etc/prometheus/prometheus.yml prom/prometheus
启动以后,我们运行http://localhost:9090 可以访问Prometheus。
Pushgateway
使用Pushgateway原因:
Prometheus采用pull模式,可能由于不在一个子网或防火墙导致无法直接拉取各target数据
需要将不同数据汇总后,再由Prometheus统一收集
其缺点:
pushgateway宕机影响范围会更大。
prometheus拉取状态up只针对pushgateway,无法做到对每个节点有效。
pushgateway可以持久化推送给它的所有监控数据
docker run -d \

  --name=pg \

  -p 9091:9091 \

  prom/pushgateway
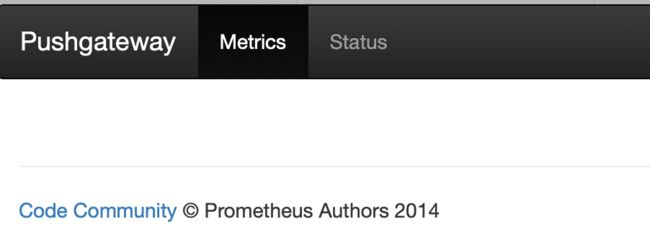
在其启动后,通过访问:http://localhost:9091就可以查看到其界面
pushgateway默认是不持久化数据的,如果需要,则可以通过启动时加入参数 :
docker run -d -p9091:9091 prom/pushgateway "-persistence.file=push_file"
向pushgateway推送数据:
1. 使用Client SDK
2. 直接使用API
使用API向Pushgateway推数据
如下为直接使用API进行数据推送:
echo "some_metric 3.14" | curl --data-binary @- http://localhost:9091/metrics/job/some_job
发送更复杂的数据,可以还上instance,表示来源位置:
cat <
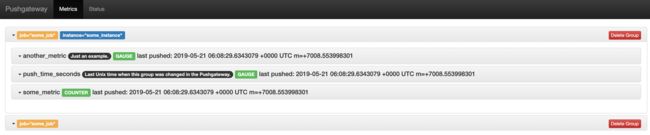 image.png
删除数据:如果某个监控数据不再需要,则只有手动删除才生效,否则仍然采集的为旧值
// 删除某个组下某个实例的所有数据
curl -X DELETE http://localhost:9091/metrics/job/some_job/instance/some_instance
// 删除某个组下的所有数据
curl -X DELETE http://localhost:9091/metrics/job/some_job
使用Client SDK向Pushgateway推数据
通过Client SDK推送metric信息到Pushgateway:
1.添加pom依赖:
io.prometheus
simpleclient_pushgateway
0.6.0
2.添加配置:在Prometheus的配置文件中配置,让其从Pushgateway上进行数据采集,这里0.51.14.23:9091为我Pushgateway的地址端口。配置完后需要重启使其配置生效
scrape_configs:
- job_name: 'pushgateway'
static_configs:
- targets: ['10.51.14.23:9091']
labels:
instance: "pushgateway"
3.代码:
@Test
public void pushToGateWay() throws Exception {
CollectorRegistry registry = new CollectorRegistry();
Gauge duration = Gauge.build().name("my_batch_job_duration_seconds")
.help("Duration of my batch job in second").register(registry);
Gauge.Timer durationTimer = duration.startTimer();
try {
Gauge lastSuccess = Gauge.build().name("my_batch_job_last_success")
.help("Last time my batch job successed, in unixtime")
.register(registry);
lastSuccess.setToCurrentTime();
} finally {
durationTimer.setDuration();
PushGateway pg = new PushGateway("localhost:9091");
pg.pushAdd(registry, "my_batch_job");
}
}
参考文档
instance: 收集数据的目标端点,一般对应一个进程,即指定其来源,如某个机器
job: 实现同一功能或目标的一组instance。 如一组机器的集合。