因为项目需要绘制地图热力图,然后我就试了一下 leaflet.js以及heatmap.js
heatmap.js主页
万事从例子出发嘛,官网给了一个最小的热力图例子。
Minimal Configuration Example
// minimal heatmap instance configuration 配置
var heatmapInstance = h337.create({
  // only container is required, the rest will be defaults  只需要一个container,也就是最终要绘制图形的dom节点,其他都默认
  container: document.querySelector('.heatmap')
});

// now generate some random data  产生随机数
var points = [];
var max = 0;
var width = 840;
var height = 400;
var len = 200;

while (len--) {
  var val = Math.floor(Math.random()*100);
  max = Math.max(max, val); //注意这里有个max用来设置最大值
  var point = {
    x: Math.floor(Math.random()*width),
    y: Math.floor(Math.random()*height),
    value: val
  };
  points.push(point);
}
// heatmap data format
var data = {
  max: max,  //所有数据中的最大值
  data: points //最终要展示的数据
};
// if you have a set of datapoints always use setData instead of addData
// for data initialization
heatmapInstance.setData(data);
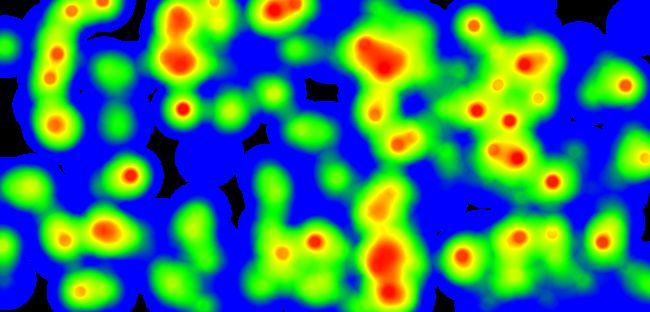
很简单的代码,然后就得到了这个效果。
总的来说就是做了两件事情
- 初始化实例,heatmapInstance
- 给实例设置数据
当然原来的页面给了一个按钮,你可以用来重新生成随机热力图。
document.querySelector('.trigger-refresh').onclick=function({
  heatmapInstance.setData(generateRandomData(200));
}
由此我们可以不断地更新热力图。
第二个例子更加简单,配置了点的半径
var point = {
   x: Math.floor(Math.random()*width),
   y: Math.floor(Math.random()*height),
   value: val,
   // radius configuration on point basis 主要是半径的配置,
   radius: radius
 };
 points.push(point);
}
然后是自定义设置的例子
// customized heatmap configuration
var heatmapInstance = h337.create({
  // required container
  container: document.querySelector('.heatmap'),
  // backgroundColor to cover transparent areas  背景颜色,可以覆盖透明区域
  backgroundColor: 'rgba(0,0,0,.95)',
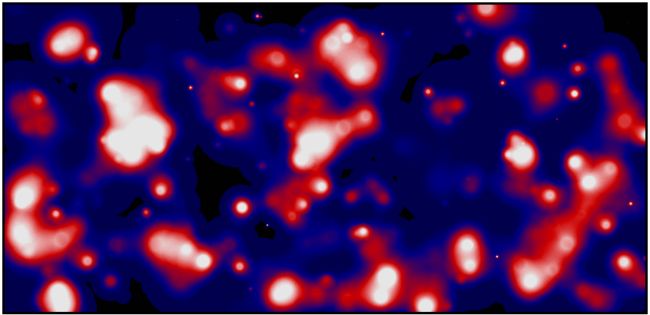
  // custom gradient colors 这里设置了颜色梯度。键值从0到1
  gradient: {
    // enter n keys between 0 and 1 here
    // for gradient color customization
    '.5': 'blue',
    '.8': 'red',
    '.95': 'white'
  },
  // the maximum opacity (the value with the highest intensity will have it) 最高透明度
  maxOpacity: .9,
  // minimum opacity. any value > 0 will produce
  // no transparent gradient transition
  minOpacity: .3
});

// now generate some random data
var points = [];
var max = 0;
var width = 840;
var height = 400;
var len = 300;

while (len--) {
  var val = Math.floor(Math.random()*100);
  var radius = Math.floor(Math.random()*70);

  max = Math.max(max, val);
  var point = {
    x: Math.floor(Math.random()*width),
    y: Math.floor(Math.random()*height),
    value: val,
    radius: radius
  };
  points.push(point);
}
// heatmap data format
var data = {
  max: max,
  data: points
};
// if you have a set of datapoints always use setData instead of addData
// for data initialization
heatmapInstance.setData(data);
总的来说,也就是在创建实例的时候,设置了一些基本配置。
关于采访者的热力图,有人已经做好了All-in-one Analytics & Feedback,不用重复造轮子(reinvent the wheel原来来自英文)。
GET VISITOR HEATMAPS. NO CODING REQUIRED.
Our awesome partners offer out of the box visitor heatmaps so you don't have to reinvent the wheel! ( plus, there's always a FREE plan to start with!)
有了三个例子傍身,这个时候我们可以去开心地看文档了。
文档告诉我们,总共有两个对象,一个叫h337,一个叫heatmapInstance。
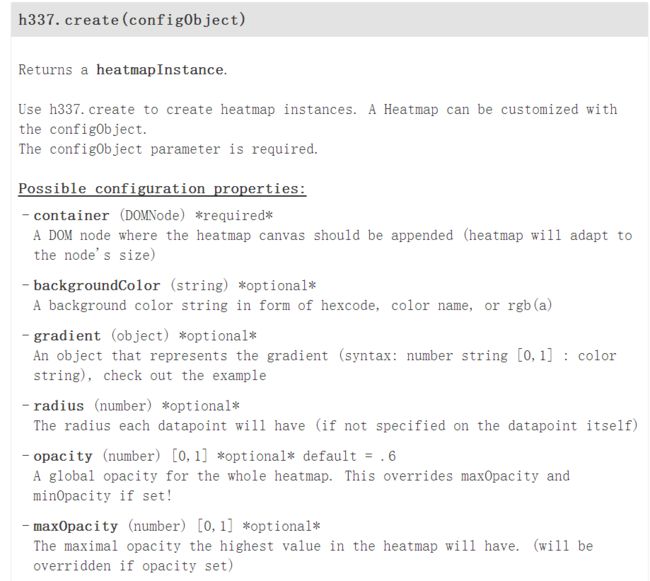
从刚才的例子里面我们已经看到,h337是heatmap的全局变量,而heatmapInstance是h337实例化的对象。文档貌似很简单,比如h337.create函数吧,除去我们之前已经知道的配置,还有一些别的配置,比如gradient,比如blur,之类的,可以自己自定义。
当然还有更多实例,详情见这里


