一、β多样性分析内容及意义
a) 样品间距离计算
Euclidean,Bray-Curtis,Unweighted_unifrac,weighted_unifrac,……,计算两两样品间距离。
意义:用于后续进一步的 β多样性分析和可视化统计分析。
b) PCA分析
主成分分析:利用方差分解,对多维数据进行降维,从而提取出数据中最主要的元素和结构的方法。
意义:揭示复杂数据背景下的简单规律。
c) PCoA分析
主坐标分析,通过一系列的特征值和特征向量排序从多维数据中提取出最主要的元素和结构。
可基于 bray_curtis、Weighted Unifrac 和 Unweighted Unifrac 等距离分别来进行 PCoA 分析。 当基于Euclidean进行PCoA分析时,PCoA=PCA
意义:选取贡献率最大的主坐标组合,进行差异揭示。
d) NMDS分析
非度量多维尺度分析 是一种将多维空间的研究对象(样品或变量)简化到低维空间进行定位、分析和归类,同时又保留对象间原始关系的数据分析方法。
适用于:无法获得研究对象间精确的相似性或相异性数据,仅能得到他们之间等级关系数据的情形。
特点:根据样品中包含的物种信息,以点的形式反映在多维空间上,而对不同样品间的差异程度,则是通过点与点间的距离体现的,最终获得样品的空间定位点图。
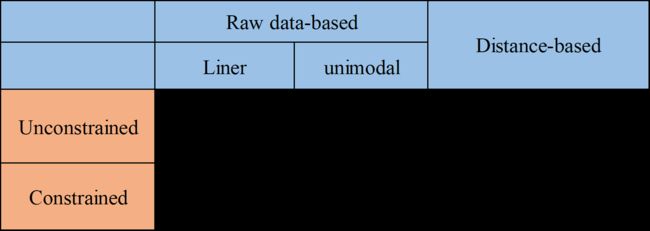
PCA、PCoA、NMDS、RDA之间的区别:
e) 相似度柱状图
根据 β多样性距离矩阵进行层次聚类(Hierarchical cluatering)分析,使用非加权组平均法 UPGMA(Unweighted pair group method with arithmetic mean)算法构建树状结构。
目的:利用树枝结构描述和比较多个样品间的相似性和差异关系。
f) 组合分析
将β多样性分析内容及性能整合/组合,用于说明样品(组)之间的差异性。
二、β多样性分析在科技论文中的描述
a) PCA、PCoA、NMDS:
示例1:
a) PCA、PCoA、NMDS :
①关于图表的描述:
Trajectory of the gut microbiota in T2D patients treated with XX,XX and XX at weeks 0, 4, 8 and 12. (a) Unweighted Unifrac PCoA of gut microbiota based on the OTU data from the pyrosequencing run. (b) Clustering of gut microbiota based on XXX distances calculated with multivariate analysis of variance (MANOVA). Each point represents the mean principal coordinate (PC) score of all patients in a group at one time point, and the error bar represents the s.e.m. Placebo: n =36; HD: n = 36. ***P<0.0001.
②关于图表结果的描述:
UniFrac PCoA and PCA showed that after 4 weeks of treatment, the gut microbiota structure of the XX group had already significantly diverged from that of its base line and of the XX group.
As the treatment progressed, the gut microbiota made no additional changes.
示例2:
a)PCA、PCoA、NMDS :
①关于图表的描述:
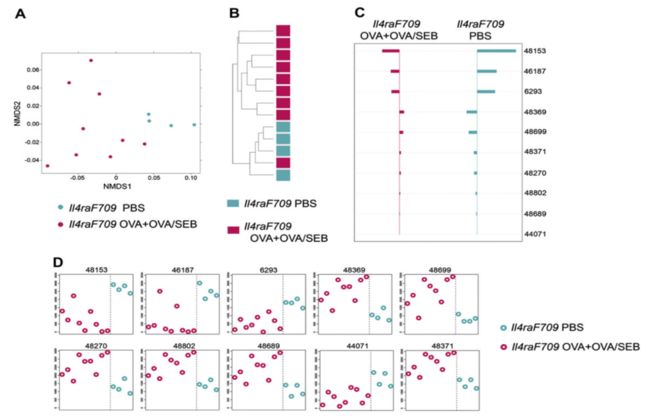
Allergen sensitization of XXX mice is associated with a microbiotic signature. 【A】NMDS based on weighted UniFrac distance between samples of XXX versus XXX mice performed on the XXX taxa the abundance of which was significantly different between groups by using the KW test. 【B】Hierarchical clustering (average linkage) based on weighted UniFrac distance between samples given abundance of XXX taxa with significant abundance differences across at least 1 of the categories. 【C】Nearest shrunken centroid analysis of OTUs that best characterize the difference between the XXX versus XXX groups. The direction of the horizontal bars reflects either overrepresentation or underrepresentation of the indicated OTUs (left- and right-sided bars, respectively). The length of the bar represents the magnitude of the effect.【D】Representation of the abundance of the OTUs identified by the nearest shrunken centroid analysis using the PAM method. Nine mice were used for the XXX group (n = 5 and 4 mice, respectively), and 5 mice were used for the PBS group.
②关于图表结果的描述:
We used 2 ordination methods, nonmetric multidimensional scaling (NMDS) and hierarchical clustering-average-neighbor (HC-AN) analyses, which examine relationships between ecologic communities, such as those of the microbial flora, to determine whether those OTUs identified by using the KW filter discriminate between XXX and XXX mice. Results revealed that the identified taxa successfully partitioned the mice into 2 distinct groups.
b)基于距离的柱状图:
示例:
①图表描述:
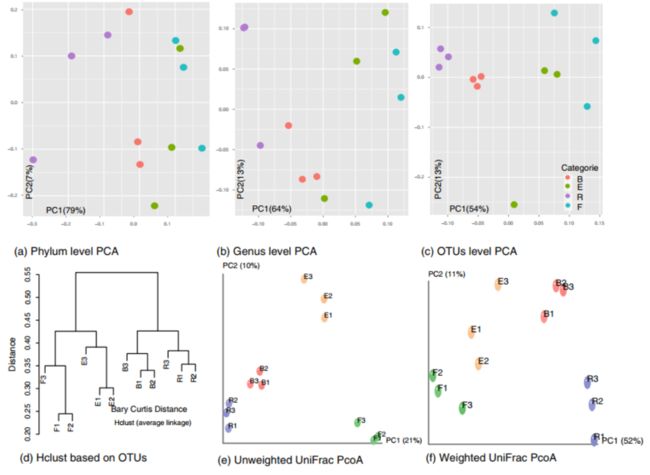
Multivariate analysis based on information at phylum, genus and OTUs levels. 【a】 PCA based on phylum distribution, 【b】PCA based on genus distribution, 【c】 PCA based on total OTUs level information, 【d】cluster analysis of OTUs profile according to Bray Curtis distance (the average linkage),【e】unweighted UniFrac PCoA result, and 【f】weighted UniFrac PCoA result. PC1 and PC2 were used to plot all PCA and PCoA results.
②关于图表结果的描述:
Different multiple variation statistical analyses were used to identify the relationships among sediments collected from the four locations. The resolutions of principal component analysis (PCA) between phyla and genus levels were different. Separating locations at the phylum level was difficult (Fig. a), but a much better discrimination was exhibited at the genus level (Fig. b) indicating that these communities shared similar phyla diversity. The best resolution was obtained at the OTU level with all tags being counted (Fig. c). The hierarchical clustering based on OTU information was also generated (Fig. d). As shown by the cluster analysis, sediment samples from the same location grouped tightly, and the sediments from the four locations could be separated into two lineages; one included XX and XX sediment while the other group consisted of sediments collected outside the XX forest. In general, the distances of samples were within 0.22–0.55, indicating that all sediments shared a high similarity rate in their bacterial structure. Similar results were also found in principal coordinate analysis (PCoA) analysis using the weighted and unweighted UniFrac metrics (Fig. e and f). The PCA, PCoA, and cluster results further indicated that XX samples was closer to XX, which was consistent with the above alpha and beta analysis results.
The clustering and PCoA results obviously showed that the bacterial communities in three, replicated rhizosphere sediments had a high similarity, which was probably due to influences (i.e., the rhizosphere effect) other than spatial variations.
温馨提示:
一般地,β多样性分析,可以独立或几种分析相结合的方式来说明样品间的相似性或差异性,而几种分析图表相结合的方式较为常见。
在分析结果中,这些分析结果往往都会提供,因此需要根据情况,提取信息。


