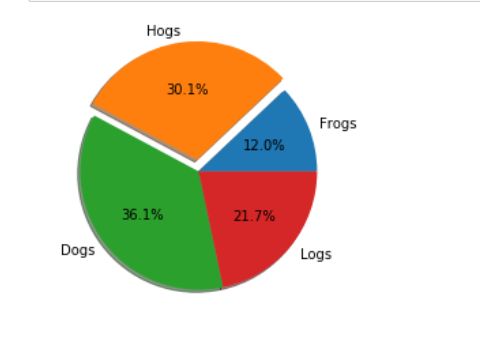
例1:
import matplotlib.pyplot as plt
labels1='Frogs','Hogs','Dogs','Logs'
size1=[10,25,30,18]
explode1=(0,0.1,0,0)
plt.pie(size1,explode=explode1,labels=labels1,autopct='%1.1f%%',shadow=False,startangle=90)
plt.show()
结果:

例2:shadow为True
import matplotlib.pyplot as plt
labels1='Frogs','Hogs','Dogs','Logs'
size1=[10,25,30,18]
explode1=(0,0.1,0,0)
plt.pie(size1,explode=explode1,labels=labels1,autopct='%1.1f%%',shadow=True,startangle=90)
plt.show()
结果:

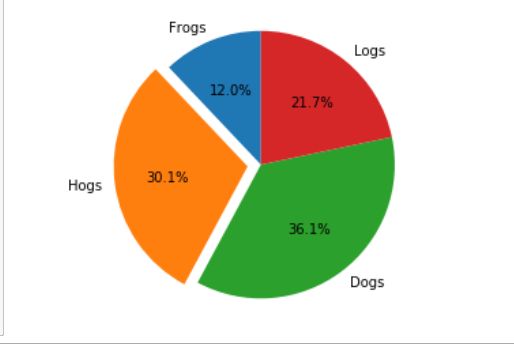
例三:调整startangle
import matplotlib.pyplot as plt
labels1='Frogs','Hogs','Dogs','Logs'
size1=[10,25,30,18]
explode1=(0,0.1,0,0)
plt.pie(size1,explode=explode1,labels=labels1,autopct='%1.1f%%',shadow=True,startangle=0)
plt.show()
结果:
例四:plt.axis('equal')
import matplotlib.pyplot as plt
labels1='Frogs','Hogs','Dogs','Logs'
size1=[10,25,30,18]
explode1=(0,0.1,0,0)
plt.pie(size1,explode=explode1,labels=labels1,autopct='%1.1f%%',shadow=False,startangle=90)
plt.axis('equal')
plt.show()
例五:设置explode的不同结果
import matplotlib.pyplot as plt
labels1='Frogs','Hogs','Dogs','Logs'
size1=[10,25,30,18]
explode1=(0,1,0,0)
plt.pie(size1,explode=explode1,labels=labels1,autopct='%1.1f%%',shadow=False,startangle=90)
plt.show()

-
直接把官网说明拿下来:
matplotlib.pyplot.pie
-
matplotlib.pyplot.pie(x, explode=None, labels=None, colors=None, autopct=None, pctdistance=0.6, shadow=False, labeldistance=1.1, startangle=None, radius=None, counterclock=True, wedgeprops=None, textprops=None, center=(0, 0), frame=False, rotatelabels=False, *, data=None)
-
Plot a pie chart.
Make a pie chart of array x. The fractional area of each wedge is given by x/sum(x). If sum(x) < 1, then the values of x give the fractional area directly and the array will not be normalized. The resulting pie will have an empty wedge of size 1 - sum(x).
制作x阵列饼图。每个楔形的分数面积由x/sum(X)表示。如果和(X)<1,则x的值直接给出分数区域,并且数组不会被规范化。得到的饼将有一个大小为1和(X)的空楔形。The wedges are plotted counterclockwise, by default starting from the x-axis.
楔形是逆时针绘制的,默认情况下从x轴开始。
Parameters:
-
x : array-like
- The wedge sizes.
-
explode : array-like, optional, default: None
- If not None, is a len(x) array which specifies(具体说明) the fraction of the radius with which to offset each wedge.(如果没有,则为len(X)数组,该数组指定(具体说明)用于偏移每个楔形的半径的部分。)
-
labels : list, optional, default: None
- A sequence of strings providing the labels for each wedge(一系列字符串,为每个楔形提供标签)
-
colors : array-like, optional, default: None
- A sequence of matplotlib color args through which the pie chart will cycle. If None, will use the colors in the currently active cycle.(一种颜色均匀的序列,饼形图将通过该序列循环。如果没有,将在当前活动周期中使用颜色。)
-
autopct : None (default), string, or function, optional
- If not None, is a string or function used to label the wedges with their numeric value. The label will be placed inside the wedge. If it is a format string, the label will be fmt%pct. If it is a function, it will be called.(如果不是无,则是一个字符串或函数,用于用数字值标记该值。标签将放置在楔子内。如果是格式字符串,则标签为fmt%pct。如果它是一个函数,它将被调用。)
-
pctdistance : float, optional, default: 0.6
- The ratio between the center of each pie slice and the start of the text generated by autopct. Ignored if autopct is None.(每个饼图切片的中心与autopct生成的文本的开头之间的比率。如果autopct为None,则忽略。)
-
shadow : bool, optional, default: False
- Draw a shadow beneath the pie.
-
labeldistance : float, optional, default: 1.1
- The radial distance at which the pie labels are drawn.(绘制饼图标签的径向距离。)
-
startangle : float, optional, default: None
- If not None, rotates the start of the pie chart by angle degrees counterclockwise from the x-axis.(如果不是None,则将饼图的起点从x轴逆时针旋转角度。)
-
radius : float, optional, default: None
The radius of the pie, if radius is None it will be set to 1.(饼图的半径,如果半径为None,则将其设置为1。)
-
counterclock : bool, optional, default: True
Specify fractions direction, clockwise or counterclockwise.(指定分数方向,顺时针或逆时针。)
-
wedgeprops : dict, optional, default: None
- Dict of arguments passed to the wedge objects making the pie. For example, you can pass in wedgeprops = {'linewidth': 3} to set the width of the wedge border lines equal to 3. For more details, look at the doc/arguments of the wedge object. By default clip_on=False.(传递给制作饼状图的对象的参数的Dict。例如,可以传入wedgeprops={'linewidth': 3}来设置楔形边框线的宽度为3。有关更多详细信息,请查看wedge对象的doc / arguments。默认情况下clip_on = False。)
-
textprops : dict, optional, default: None
- Dict of arguments to pass to the text objects.(以字典形式传递给文本对象作为参数。)
-
center : list of float, optional, default: (0, 0)
- Center position of the chart. Takes value (0, 0) or is a sequence of 2 scalars.(图表的中心位置。取值(0,0)或是2个标量的序列。)
-
frame : bool, optional, default: False
- Plot axes frame with the chart if true.(如果为真,则绘制轴与图表的框架。)
-
rotatelabels : bool, optional, default: False
- Rotate each label to the angle of the corresponding slice if true.(如果为true,则将每个标签旋转到相应切片的角度。)
Returns:
-
patches : list
- A sequence of matplotlib.patches.Wedge instances.(一系列matplotlib.patches.Wedge实例。)
-
texts : list
- A list of the label matplotlib.text.Text instances.(标签matplotlib.text.Text实例的列表。)
-
autotexts : list
- A list of Text instances for the numeric labels. This will only be returned if the parameter autopct is not None.(数字标签的文本实例列表。仅当参数autopct不是None时才会返回。)