网络与新媒体1501班 20151302948 穆妮娜·艾西拜
The United Nations International Children's Emergency Fund (UNICEF), formerly known as the "United Nations International Children's Emergency Assistance Foundation", was established on December 11, 1946, and was originally designed to meet the needs of European and Chinese children after the Second World War Urgent needs. Since 1950, its work has expanded to meet the long-term needs of children and mothers in all developing countries in the world. In 1965, the United Nations Children's Fund won the Nobel Peace Prize for "promoting the friendship between nations."
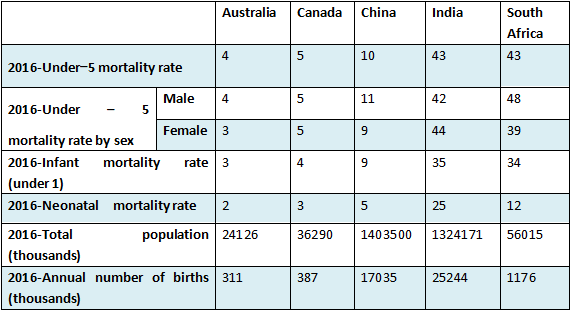
I searched "The state of the world's children 2017 stature tables" from UNICEF, and the following data is selected from this statistical table. The data includes data from five countries: Australia, Canada, China, India, and South Africa. The statistics in this table summarize all the data for 2016.
The data shows that the mortality rate of young children in various countries is still high in 2016.It is chilling that every country has many children who die for various reasons every year. Some children are still under one year old, and some children even died when they were still babies.
For our convenience, I used the Dydata to draw the following chart. The name of this chart is The double ring graph. The benefit of The double ring graph is that the comparison between the five countries is very obvious.
In this chart, I compared Under–5 mortality rate, Infant mortality rate (under 1), and Neonatal mortality rate in five countries: Australia, Canada, China, India, and South Africa. It is not difficult to see that the child mortality rate in India and South Africa far exceeds the child mortality rate in the other three countries.
I also drew a chart with Dydata about the Under–5 mortality rate by sexuality in 2016 in these five countries. The name of this chart is The column chart.
Sadly, the boy mortality rate in these five countries is almost always greater than that of the girl child. As can be seen from the figure, the child mortality rates in South Africa and India are much higher than Australia, Canada and China. In 2016, the number of deaths of boys in South Africa was 48. However, India did not surpass my expectation. The death toll of girls was higher than the death toll of boys. The death toll for girls was 44 and was the second highest.
One of the reasons why I look for this data is to urge everyone to protect children. Children around the world should enjoy the happiness that the world has brought them, instead of facing death when they haven’t grown up yet.
Finally, the reason why I use Dydata to chart is that Dydata always surprises me. Charts drawn with Dydata always make the data easier to read and understand. And the benefit of charts is that it makes it easier for you to see what you mean in the data. So, I'm glad I can draw a variety of charts.


